My wife, Lori, was recently walking on the trail behind our house when she came across another person walking three dogs. We have two dogs ourselves, and Lori couldn’t resist greeting the canines.
The dog walker indicated that one of the dogs (we’ll call her Rosie) was friendly, which prompted Lori to approach and extend her hand for the dog to smell to gain her trust, also known as “the sniff test.”
When Lori extended her hand, a second dog began to approach. Concerned, she abruptly pulled her hand back. Rosie reacted by snapping as Lori withdrew her hand. Lori immediately began walking away, but she realized it was too late as she saw her hand bleeding from a deep laceration on her index finger.
What went wrong, and how could one reduce the risk of being bitten by a new dog? We’ve included several Cause Map™ visual representations to help find solutions that could effectively reduce risk not just for Lori, but for dog lovers everywhere.
Start Simple with a 5-Why Cause Map™ Diagram
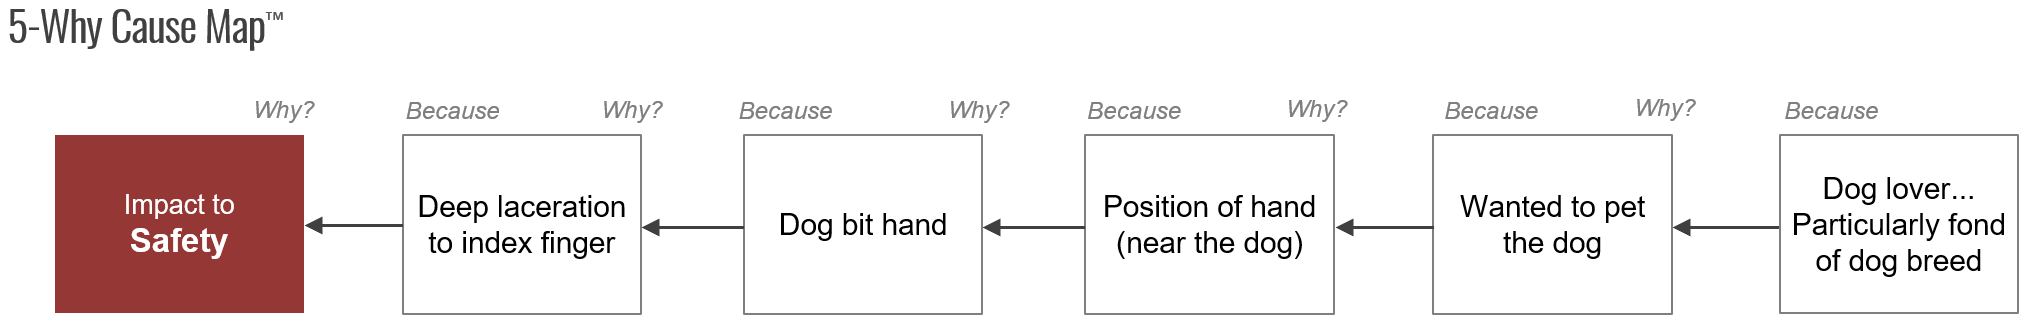
This incident, just like any other, provides multiple opportunities for lessons to be learned. Any incident analysis can begin with a simple 5-Why explanation.
Asking "why" five times is not a hard and fast rule, but a guideline for how to get started. The number of times you need to ask "why" depends on the clarity required to explain the problem effectively and reveal applicable solutions. Conventional 5 Whys is typically captured as written statements down the page. A 5-Why Cause Map diagram takes advantage of visual communication to capture the cause-and-effect relationships.
To read the diagram, you start on the left, often with the goal that was impacted, and read to the right, inserting “because” or “was caused by” in place of the arrows. When looking at the example below, we’d say that the safety goal was impacted because there was a deep laceration on the index finger. That laceration was caused by a dog biting the hand. The dog was able to bite the hand because of the hand being close enough to the dog.
Expand the Cause Map™ Diagram with Additional Perspectives
It's important to note that while the above 5-Why Cause Map diagram is accurate, it doesn’t represent a complete explanation. But, that's not a bad thing. It provides a quick and simple start to an analysis that can be expanded.
For example, someone might argue that Lori was bitten because the dog felt threatened and snapped at her hand. This would be represented in a similar fashion.
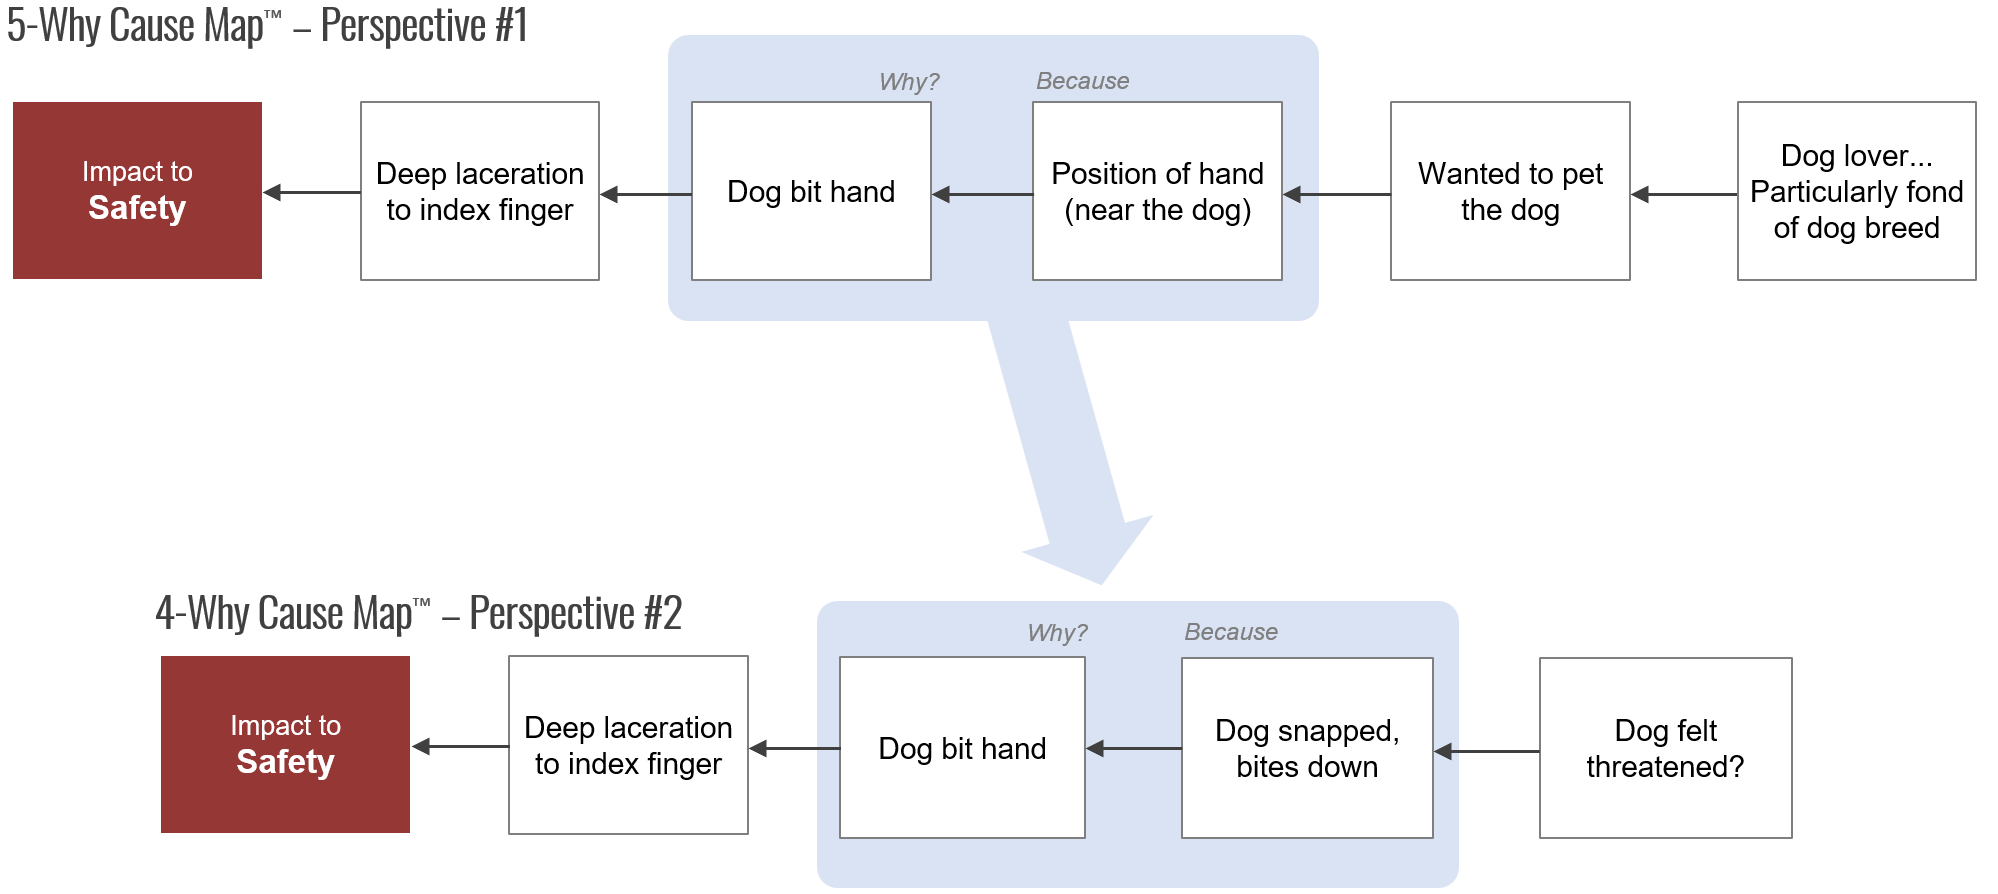
We now have two different diagrams for this incident, so which is accurate?
The answer is BOTH. Trying to determine which is right highlights a common problem-solving communication trap.
Don’t Fall into This Common Problem-Solving Communication Trap
We are all biased toward our explanation of a problem. When someone provides an alternate explanation, we tend to immediately disagree. After all, if I know that I am right, then any answer that differs must be wrong.
The drive to get to the one root cause adds additional fuel to this disagreement and can lead us toward a blame mentality. This is why you must build the diagram, as it visually demonstrates that both explanations are accurate and can provide a more complete understanding of the incident.
Common Criticism: The 5-Whys Method is Not Scientific Because It’s Not Repeatable
Some people believe that because different people build different 5-Whys for the same problem, it’s evidence that using 5-Whys for root cause analysis is not scientific. This criticism reveals the level of confusion regarding the basic principle of cause and effect.
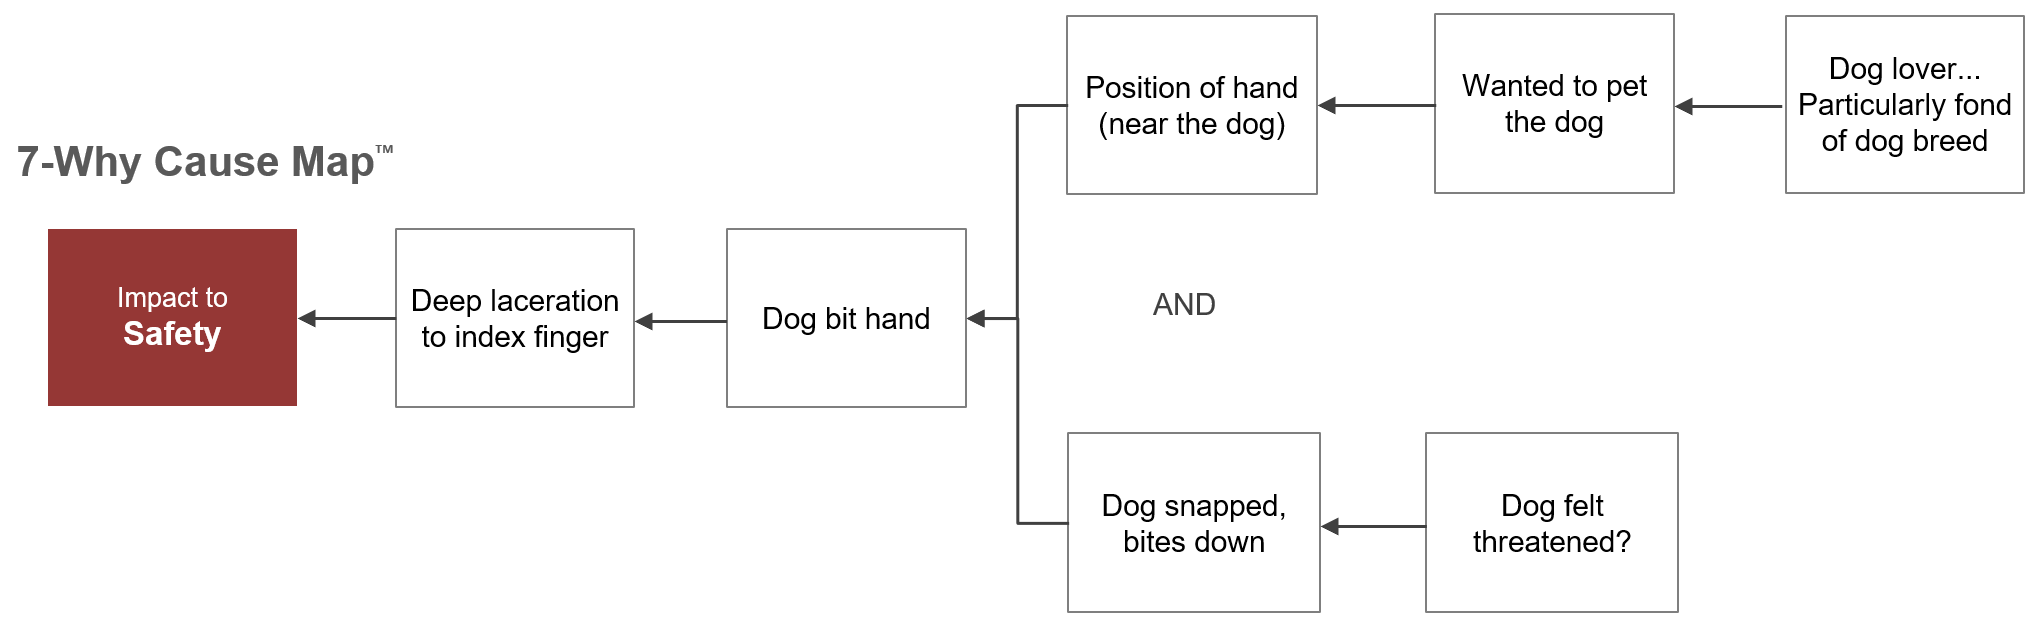
It’s normal and expected for different people to build different 5-Whys. As long as the 5-Why is accurate, we can add it to the existing Cause Map diagram. Building a map of this discussion allows you to accommodate different perspectives and will prove beneficial as it reveals more opportunities to mitigate risk.
Here is an example of the two 5-Whys from above combined into a 7-Why Cause Map diagram:
The Benefit of Revealing Multiple Causes
Every incident you investigate consists of multiple causes. The more causes you are able to reveal the more opportunities you have to reduce the risk.
As you continue to add perspectives, your Cause Map diagram will grow. This is why a 5-Why baseline is a great starting point, it engages others in the problem-solving process. Others will be happy to point out what is missing from your 5-Why perspective. But, instead of debating the cause, simply add their perspective (causes) to the map. This has enormous benefits for incident investigators, who can:
- Easily navigate potential miscommunications for a more efficient investigation
- Reveal a system of causes to minimize blame (right-answer thinking)
- Expose more opportunities to reduce risk
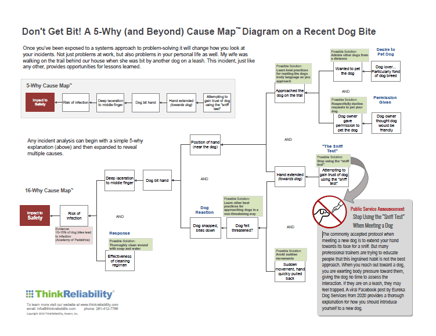
Solutions such as not using the sniff test, admiring dogs from a distance, learning how to approach dogs in a non-threatening way, and others all can be applied as solution suggestions to their respective causes on the map.
What’s Next?
Interested in seeing more? Download a 14-Why Cause Map diagram with multiple perspectives and the proposed solutions mapped.
Want to learn how to effectively combine multiple perspectives in one investigation yourself? We have several training offerings that might be of interest to you! From a short course on how to apply cause-and-effect thinking when breaking down daily problems to a webinar with tips for using the Cause Mapping® template. See all upcoming events.