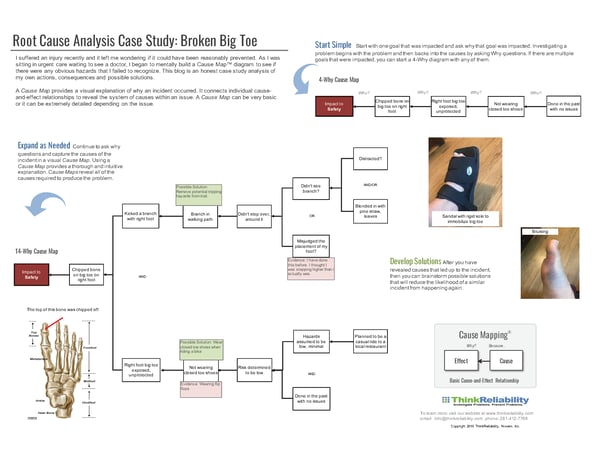
As I was sitting in the urgent care waiting to see a doctor, I began to wonder if it could have been reasonably prevented. I began to mentally build a Cause Map™ diagram to see if there were any obvious hazards that I failed to recognize. A Cause Map diagram is a tool to objectively lay out cause-and-effect relationships to explain how something happened. It connects individual cause-and-effect relationships to reveal the system of causes within an issue. A Cause Map diagram can be very basic, or it can be extremely detailed depending on the issue. This blog is an honest analysis of my own actions, consequences and possible solutions.
What Happened
A few Sundays ago, I decided to hop on my bike to ride to the local pizzeria (in flip-flops) to catch up with some friends and watch football. There are two different routes I could take. The more dangerous route is on main roads and therefore a bicyclist must share the road with more cars. The other route utilizes less busy neighborhood roads, and it includes a short walk-a-bike section through a wooded area. I chose the latter, which I have done many times before, and off I went. Both routes are about the same distance, 1.7 miles and about 10 minutes.
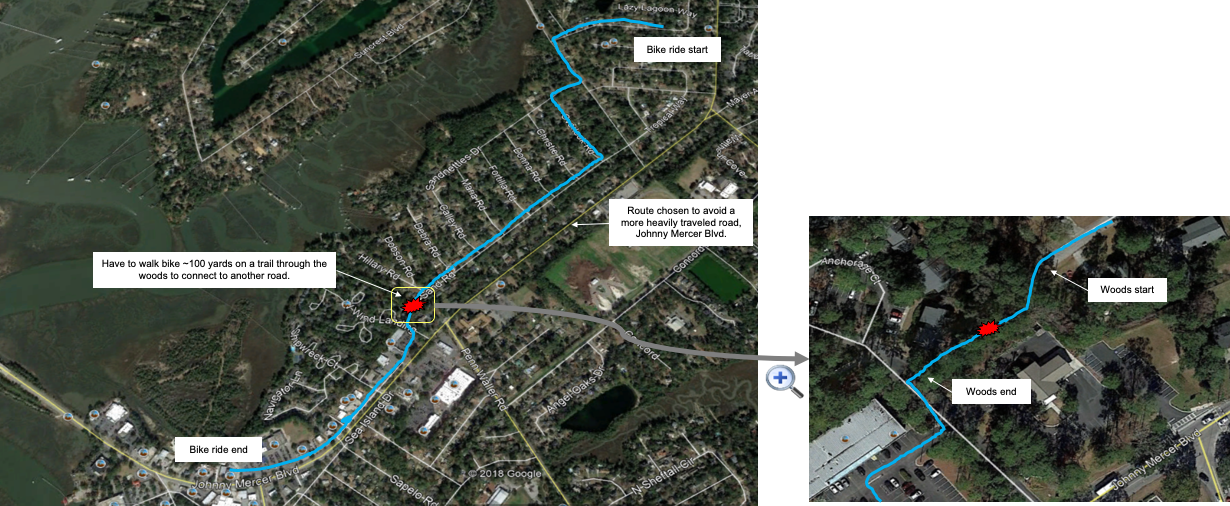
I arrived at the wooded section, hopped off my bike and proceeded to walk it through the woods. As I was doing this, I tripped over a small branch. I didn’t fall, but I did feel pain in my right foot's big toe. I assumed I just stubbed it and it would stop hurting soon. I finished the walking part of the route and then hopped back on my bike when the trail met the pavement. Riding my bike didn’t hurt near as much as walking. When I arrived at the restaurant, I had to walk on the outside of my foot to avoid pain. I still didn’t think it was a serious injury.
My toe was still hurting the next morning, so I decided to go to urgent care to have it checked out. At this point, I was starting to guess it was broken. I must mention, this injury occurred seven days before I left to go on vacation to visit Machu Picchu, Peru. If I was injured, then I wanted to do everything in my power to enable quick and complete healing. So, there I was sitting in urgent care wondering if and how this was going to impact my vacation. I was also wondering how I could have let this happen. Did I see the branch? If I choose to wear flip-flops, am I being complacent?
The X-Ray revealed I broke the last phalange of my big toe on my right foot. The doctor gave me a stiff-soled sandal to wear, instructed me to RICE it (rest, ice, compress, elevate), and told me to stay off my foot as much as possible. I did just that. I wore the sandal all day except when I was in the shower. I propped my foot up and iced it twice a day for seven days straight. I even wore my sandal through the airport and the first couple of days sightseeing in Peru. By the time I got to Machu Picchu, my foot felt pretty good and I could hike at my normal pace. I was very pleased!
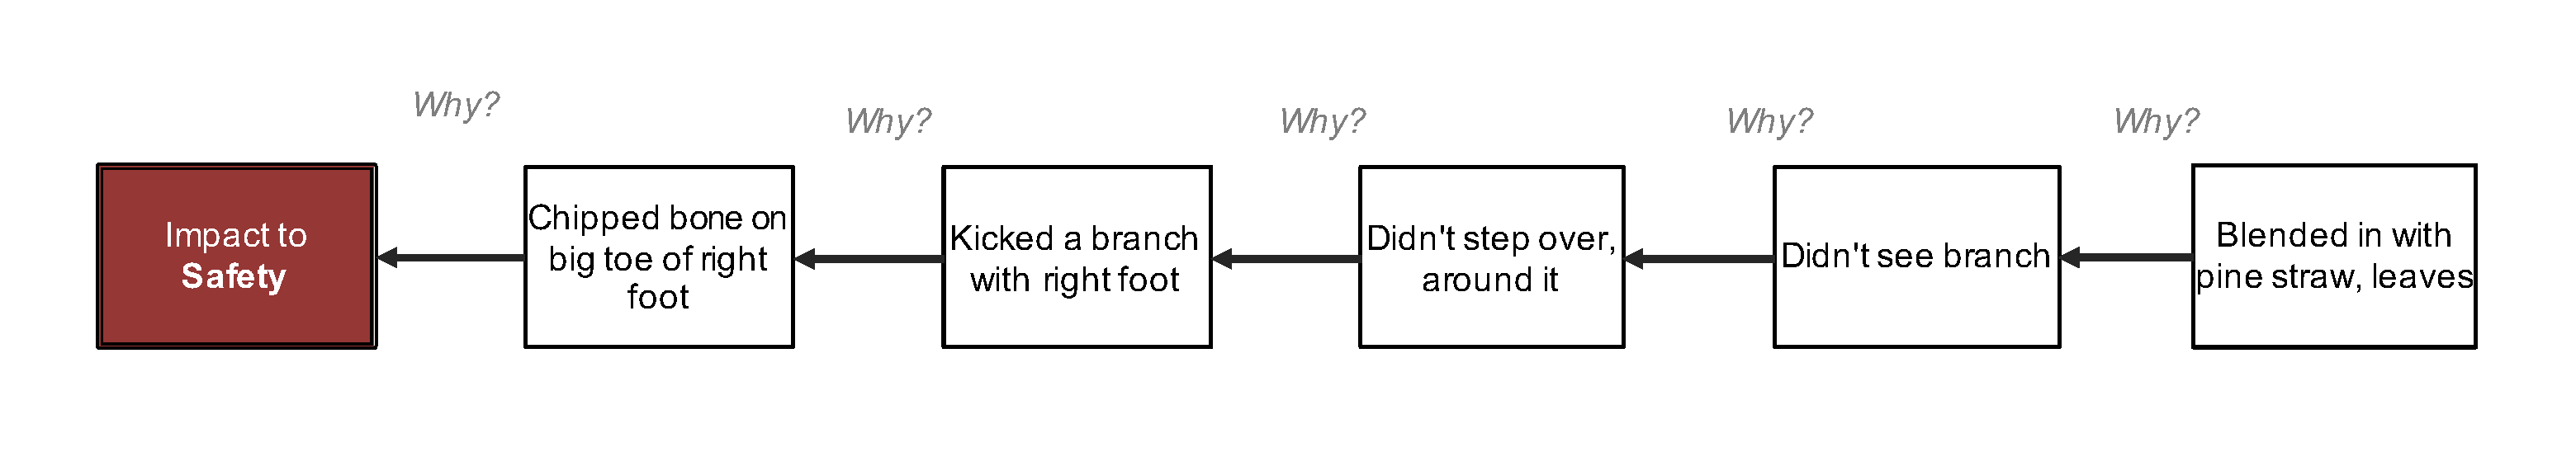
I started the Cause Map diagram with a few Why questions. This is my initial 5-Why.
By asking more Why questions, the Cause Map diagram expands into a 14-Why as details are added. (Click on the image below to download the PDF.)
Avoiding Recurrence
After building the Cause Map diagram, I realized that my non-work-related injury looked a lot like many work-related injuries. A hazard contacted an unprotected body part. The injured person was aware of potential hazards and accepted the risk because they determined the severity of potential consequences to be low. Part of the reason I determined the risk to be low is because I have performed the task in the past without issues, i.e. negative consequences. All of this sounds familiar. Right?
As the Cause Map diagram builds and evidence is collected, potential solution options to control causes become clearer. In my case, I could clear the path in the woods or wear closed-toe shoes when riding my bike. Either solution will lower the risk of a similar incident recurring. If I implement both solutions, the risk is reduced even further with the employed layers of protection.
In my case, I am solely responsible for making the decision to accept the risk. However, on the job, employees have the benefit of a team of people who help identify hazards and methods to mitigate them, so they don’t have to accept a high level of risk. Most employers discourage employees from “accepting risk” and continuing to work. Tools such as standard operating procedures, stop work authority, pre-job hazard analysis, safe work permit and take-two cards are all meant to help employees avoid accepting risk and reduce the likelihood of incidents. Taking a few minutes on the front end to make a task safer could reduce or prevent time spent on the back end caring for an injury.
If you enjoyed this simple example of how to build a Cause Map diagram for an incident, join us for our Root Cause Analysis 101 online short course to learn more about Cause Mapping® root cause analysis.