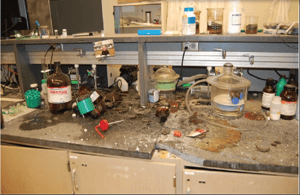
The school science laboratory can establish a lifetime of fascination for the sciences; instilling wonder in the inner workings of molecules and machines. Unfortunately, the laboratory is also a place of hidden dangers. The inherent hazards students are dealing with are always present and must be respected by all. In this blog, we will look at a laboratory fire that occurred at Texas Tech University (TTU) in 2010.
 With any incident, the learnings need to be understood and the solutions made a sustainable part of the culture of working in the laboratory. Fixing a single item is seldom adequate, as there are always a number of causes at work.
To help us take that look, we will use a Cause Map™ diagram to understand the causes of the incident, and what can be done about them.
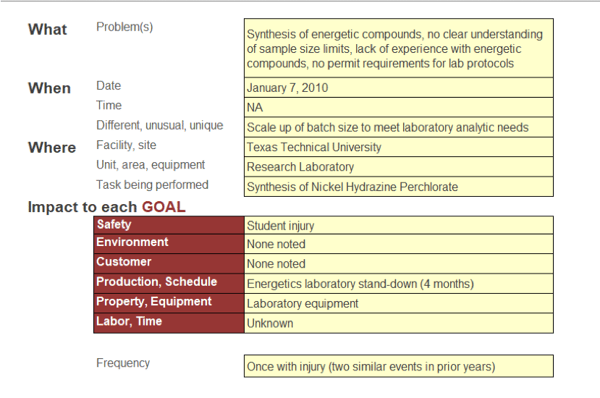
The starting point in the Cause Mapping® method is the problem outline. With the outline we can capture the viewpoint of the participants: the what, the where and the when. We also capture the viewpoint of the larger organization (in this case, the university), “What is the impact to the organization’s goals?”

We also need to note that there were two previous incidents (with no injuries) known to have occurred at TTU, but there were no formal tracking processes for these near misses, with ineffective subsequent communication.
Cause Map™ Diagram
Once the outline is completed, we can put together an initial 5-Why analysis. It is important to note that the 5-Why is intended to be a starting point. There can be many different 5-Whys for any given incident, but the important point is to start.

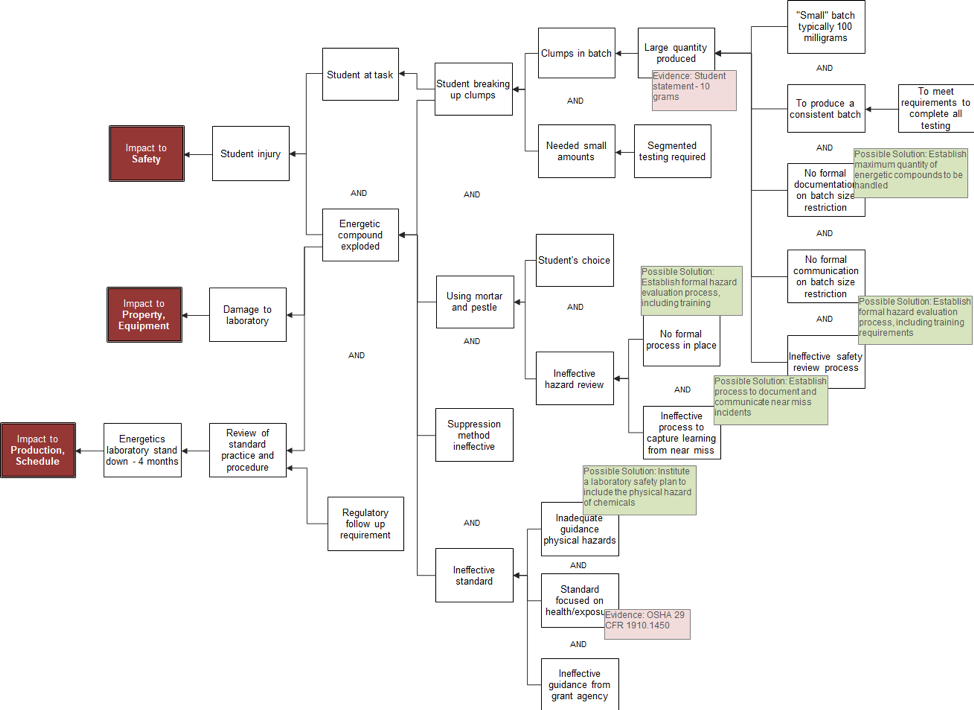
Using the initial 5-Why Cause Map diagram as a starting point, we can add more detail and build the Cause Map diagram to get a more complete picture of the incident.
When we look at the Cause Map diagram, we can see systemic deficiencies in the laboratory with communication of information, the documentation system and training. We also see there are areas for improvement in the underlying standards, since there was no specific call out for handling physical hazards. All of this is part of the series of causes that led to this incident.
It is critical to remember that any incident is comprised of a number of causes. A thorough investigation must look at more than the immediate event; it must look at all the causes related to what occurred.
Potential Solutions
The Cause Map diagram now becomes our guide for looking for solutions. Several ideas are included in the analysis above to show the need for systematic and sustainable processes to ensure the risk of future incidents is as low as possible.
Data for this Cause Map diagram was drawn from the Chemical Safety Board investigation of the TTU incident, which you can access here. This blog is based on the report and does not include how the university updated their policies and procedures in the laboratory.
You can see information on other laboratory safety incidents from the CSB here.


