
The Massachusetts communities of Lawrence and Andover were rocked by a series of explosions and fires, resulting in one fatality, 21 injured, the destruction of five homes and damage to more than 113 other houses. The incident, which happened around 4 p.m. on Sept. 13, 2018, led to the evacuation of thousands of residents and more than $1 billion in damage. We used the National Transportation and Safety Board investigation from Nov. 14, 2018, as well as public records for this Cause Map case study.
Incident Overview
As it turns out, high pressure gas was inadvertently introduced into home systems (e.g. water heaters, boilers and furnaces) that were not designed to handle the high pressure. The resulting explosions and fires were catastrophic. To understand what happened, we created a Cause Map of the incident. Cause Mapping is the root cause analysis method we use at ThinkReliability.
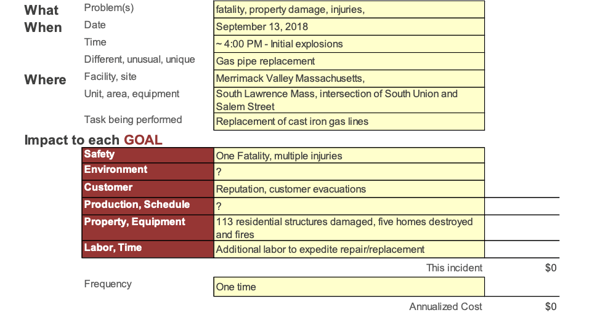
Step one of the Cause Mapping method is to define the problem. We do this using our problem outline, shown below. The online version of the issue includes information like the who, what, when, where and impact on the Merrimack Valley community.
Timeline of Events
In our Cause Mapping template, we include a sheet dedicated to developing a timeline of events related to the incident. By documenting this information on a timeline, we can see how the incident unfolded. (Remember, this timeline represents the chronology of events, not the causality.) The timeline provides clarity and answers questions like:
- “When was the pipeline installed?”
- “When was pressure noted?”
- “When were alerts made?”
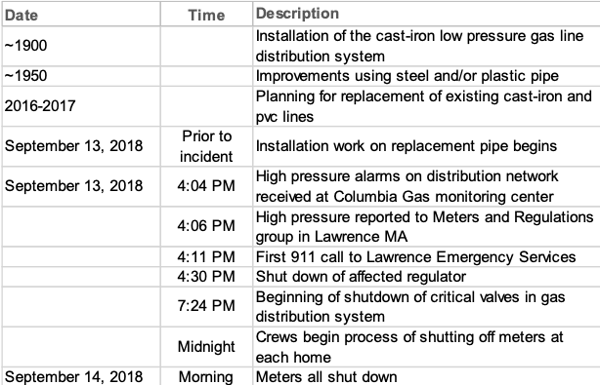
When we do this, we find out important information, including some of the gas pipelines were installed in the early 1900s and high pressure alarms were first noted at 4:04 p.m.
5-Why Cause Map

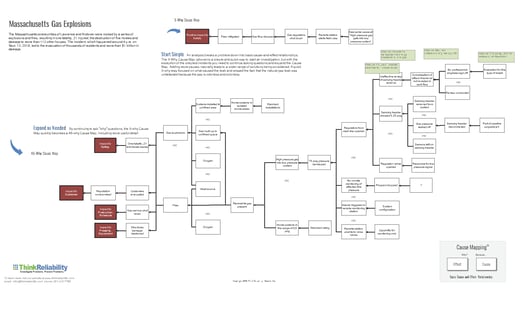
With the incident overview and the timeline established, we can put together an initial 5-Why Cause Map. A 5-Why begins with the impacted goal, and then we build on the goal (to the right). So if we look at the above 5-Why, there was one fatality and 21 injured individuals. Why? Gas explosions. Why were there gas explosions? Because there was high pressure gas in a low-pressure system. And so on.
Creating a Detailed Cause Map
The 5-Why serves as a starting point for understanding the cause-and-effect relationships that led to the explosions, but it’s more complex than that. From there, we can develop a more detailed Cause Map to see there was a system of causes, not just five. Ultimately, as we collect and add more detail, we’re able to use the Cause Map to see multiple areas for process improvement.
In this scenario, we propose changing regulations, requiring additional engineer review and implementing a project review process. We’re able to place the potential solutions on the map in green to show the control points for preventing and reducing the risk of future incidents.
View a detailed version of this incident by clicking on the thumbnail below.
What do you think? Are there any causes we missed? Any solutions you think we could add to mitigate risk in the future? Leave us a comment below.


