
On June 21, 2019, a refinery in Philadelphia, Pennsylvania experienced an explosion and fire in the Hydrofluoric Acid (HF) alkylation unit--releasing nearly 5,000 pounds of HF into the air. This incident occurred during normal operation of the refinery. What is quite unnerving was that there were no indicators of any issue or upset.
Please note, the Chemical Safety Board (CSB) investigation of the incident is still in progress. The information in this blog is pulled from their factual update published on Oct. 16, 2019.
Problem Outline
To begin our understanding of the incident, we will begin the Cause Map diagram, a visual representation of cause-and-effect relationships, with the problem outline. With the outline, we will be able to capture the viewpoints of the participants: the what, the where and the when. We will also capture the viewpoint of the overall organization by asking, “What is the impact to the organization’s goals?”
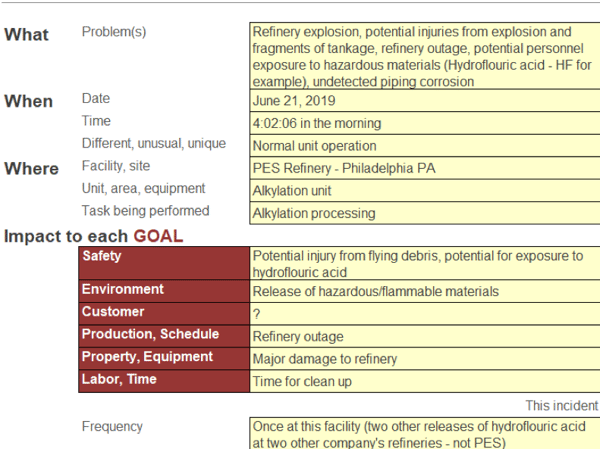
Shortly after the explosion, the refinery was closed and filed bankruptcy. Note, there have been two other releases of HF at other refineries (different companies).
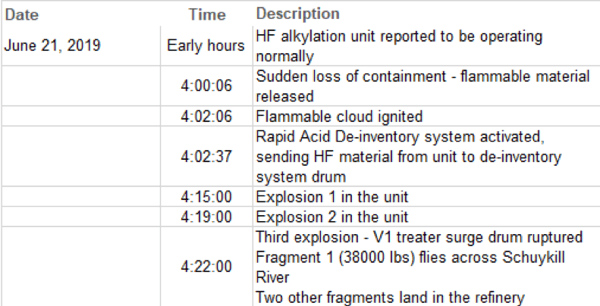
Timeline
A preliminary timeline can also be quite valuable for the analysis, keeping in mind that the timeline answers the question of chronology, not causality.
Again, take note of how quickly the incident developed.
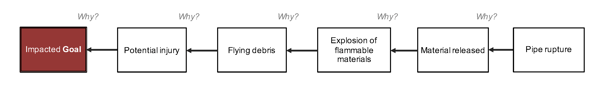
5-Why Cause Map™ Diagram
Once we have completed the outline, we can put together an initial 5-Why analysis. The 5-Why is intended to be a starting point. Since there are many different points of view about the “What” of an incident, there can be many different 5-Why diagrams. It is critical to begin the review and build it out from there.
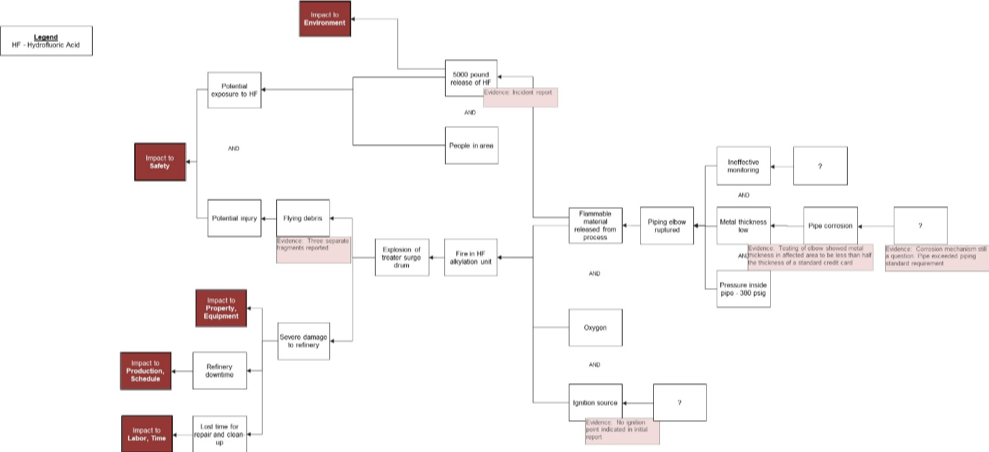
Once we have our starting 5-Why, we can continue the process of building the Map. See the preliminary Cause Map diagram below. The final report has not been completed, but even here we can see the picture of the incident emerge, and the need for the further follow-up required.
Adding Detail for Clarity
With complex incidents, it is not uncommon to discover new areas to further check as the investigation progresses. We need to gain a clearer understanding of the causes involved. As you collect more evidence, the Cause Map diagram develops. This also points to another concept: “Adding detail improves clarity.”* By adding further detail, the explanation of the incident becomes easier to understand. It does seem counter-intuitive at first glance. But consider that large incidents, such as the PES refinery fire, are made up of a number of causes, and detail must be added to fully explain and understand those causes.
The Chemical Safety Board (CSB) is continuing its investigation into this incident. You can see further developments by checking their website at www.csb.gov.
* Adapted from the concept in the book, The Challenger Launch Decision by Diane Vaughn.


