
How Two Different 5-Whys Provide One More Complete Explanation
Whether it’s at home, work, or for recreation, people walk somewhere each day, but there are risks in this simple mode of transportation.
Despite safety measures like sidewalks, increased illumination, improved signal timing at intersections and beacons that alert drivers to stop when people are crossing, pedestrian motor vehicle crash deaths have increased 51 percent since reaching a low point in 2009, the Insurance Institute for Highway Safety (IIHS) reported1.
In fact, pedestrian deaths in 2020 increased 4.8 percent over the previous year, from 6,412 in 2019 to 6,721 in 2020. “Factoring in a 13.2% decrease in vehicle miles traveled (VMT) in 2020, the pedestrian fatality rate was 2.3 per billion VMT, a shocking and unprecedented 21 percent increase from 1.9 in 2019,” the Governors Highway Safety Association noted2. This accounts for the largest annual increase since data collection began in the mid-1970s, the report added. This data point is especially alarming when you take into consideration that there were fewer drivers on the road in 2020 because of the pandemic.
While statistics did not differentiate between pedestrians who were hit in crosswalks and those who were hit in other places, it is evident there is a problem. By understanding the cause-and-effect relationships within this issue we can identify different ways to reduce the risk of a person being hit by a car in a crosswalk.
Competing Perspectives
When a pedestrian is hit in a crosswalk, there are two opposing perspectives. Either the driver wasn’t watching the road, or the pedestrian didn’t look for vehicles before entering the crosswalk. Who’s at fault?
In reality, both causes are accurate and help determine potential preventive measures for the accident. An issue always has multiple causes, and the more causes that are revealed, the more potential solutions will come to light to change the outcome. Our Cause Mapping® method breaks down a problem into a basic cause and effect relationship and can be applied to all types of problems regardless of complexity.
Let’s take a deeper look at two of the causal paths for the crosswalk incident.
The Driver Was Not Watching the Road
Below is a linear 5-Why Cause Map™ diagram. The investigation begins with a negative consequence – in this case, the safety impact of a pedestrian being struck by a vehicle as they crossed the road. You move backward through the incident asking “why” questions. We like to compare this part to a toddler asking why as they learn about the world around them. They use this method to learn about cause and effect, consequences, and to help determine how to react to a situation. 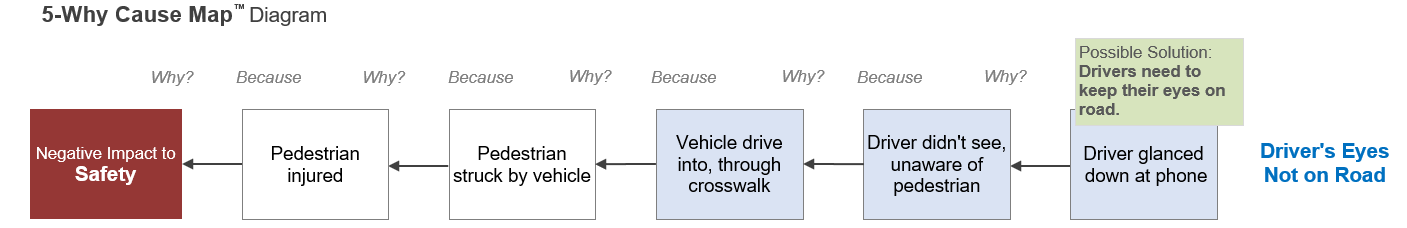
Read the analysis from left to right using the “Why” questions above each effect. Use the word “because” for each of the connector arrows. For example, why was the pedestrian injured? Because they were struck by a vehicle, and so on.
The Pedestrian Didn't Check the Road
On the flip side of the “who’s at fault?” question is the pedestrian. Like the first 5-Why, this one begins with the same safety impact. The cause, though, is because the pedestrian stepped into the crosswalk unaware there was an approaching car. Why? They didn’t check for oncoming traffic before entering the roadway, either because they were distracted or because they believed they had the right of way. 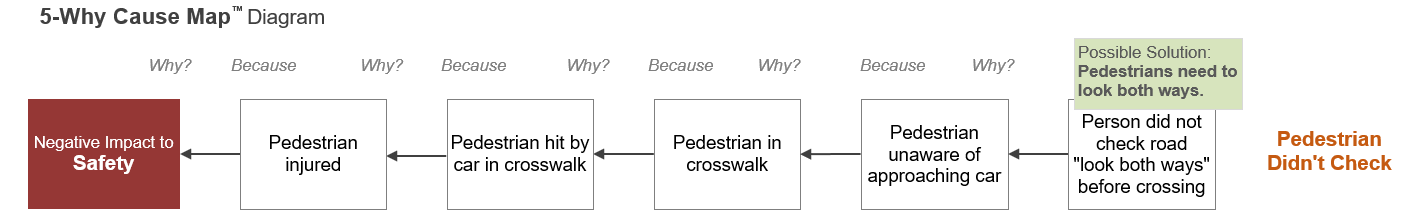
Two Different 5-Whys Combine Into One, More Detailed 8-Why
Different people naturally write different 5-Whys because they see causes from their point of view, but their point of view doesn’t change how the incident occurred. The two 5-Whys in this crosswalk case study are accurate, but they’re different. Both causal paths had to occur for the accident to happen. If the pedestrian was not in the crosswalk, they would not have been struck. Likewise, if the driver was paying attention to the road, they would not have hit the pedestrian.
By combining the two 5-Whys above, you can see a more detailed 8-Why Cause Map diagram with two paths below. Exploring both paths can help you determine multiple solution options that could prevent a similar incident from taking place. It’s important to understand that when any single contributing cause is controlled, risk is reduced. Controlling multiple causes creates an exponential reduction in risk known as “layers of protection.” 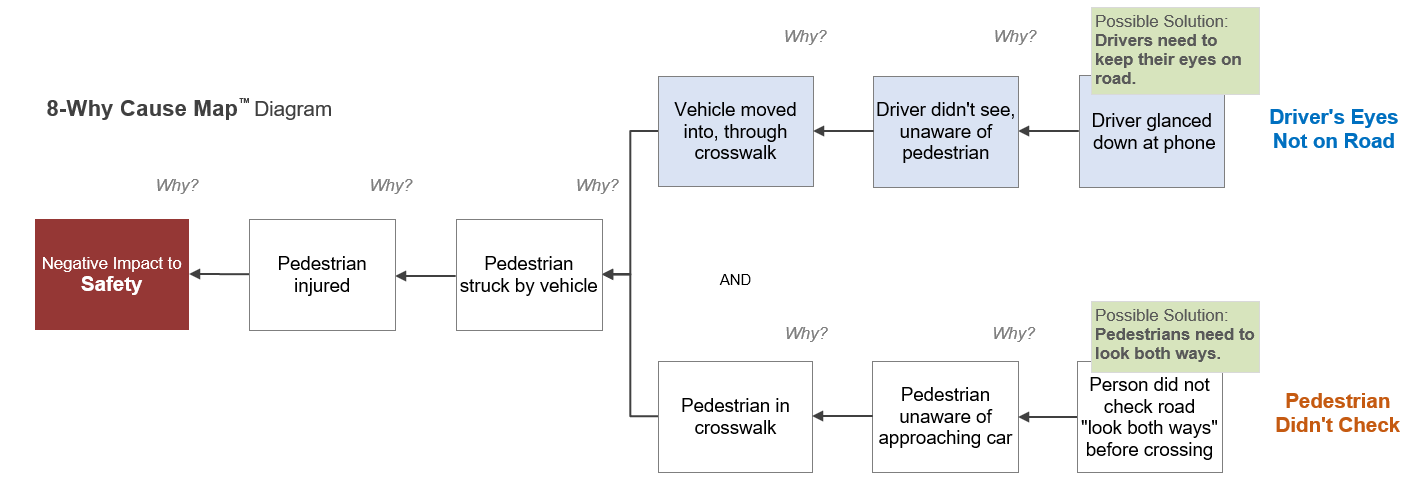
Controlling any cause can prevent the incident. For example, the driver can drive more cautiously and keep their eyes on the road, rather than on their phone. Another solution could be turning on “drive mode,” to help keep them focused on driving.
Alternatively, the pedestrian can choose when, where and how they cross the road. They can ensure the road is clear the same way in which children are taught to “stop, look and listen” for oncoming traffic before crossing the road.
The more thorough your investigation, the more causes and potential solutions will be outlined. There are causes and solutions that extend beyond the driver and pedestrian, as well. The key is to look objectively at the causes and to prioritize solutions, implementing those that will be the most impactful, have the greatest reduction in risk, and that will be the most cost-effective for you or your company.
Cause Mapping® Concepts Span Industries
No matter if you’re an individual with a zero-dollar budget or a Fortune 100 company with endless resources, cause-and-effect thinking doesn’t require teams of people or a hefty sum. It doesn’t require proprietary algorithms or special software.
To test this approach, all one has to do is channel their inner 3-year-old by asking “why” questions and working backward through an issue. Start with a simple 3- to 5-Why Cause Map diagram and expand it just as we did above. Add as much detail as needed to build in layers of protection and reduce risk to an acceptable threshold.
Download a copy of our Cause Mapping Investigation Template in Microsoft Excel to experiment or use this PDF with your group to show how a Cause Map diagram starts simple and then expands to reveal a more thorough set of solutions.
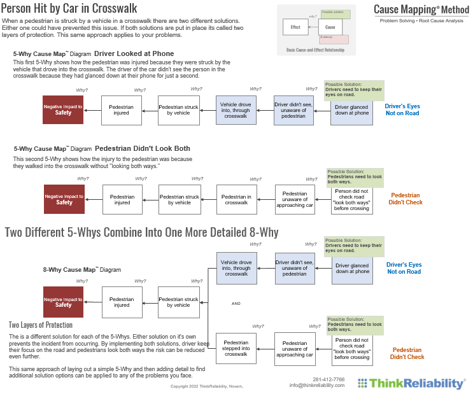
Summary of Two 5-Whys Combined into an 8-Why
We’ve created a summary PDF of this incident for you to review with your group. Check it out here, or by clicking the thumbnail below.

1 “Fatality Facts 2019: Pedestrians.” Insurance Institute for Highway Safety, Mar. 2021, https://www.iihs.org/topics/fatality-statistics/detail/pedestrians.
2 “Pedestrian Traffic Fatalities by State | 2020 Preliminary Data.” Governors Highway Safety Association, 23 Mar. 2021, https://www.ghsa.org/sites/default/files/2021-03/Ped%20Spotlight%202021%20FINAL%203.23.21.pdf.


