
When we first learned to walk, falling was part of the process (a regular occurrence, normal). When you’re small and close to the ground, falling isn’t usually a problem. But as we get older and taller, we’re farther from the ground, we weigh more, and our bones aren’t as pliable. As an adult, the risk of serious injury from a fall is much higher.
At work, falls can be serious. According to the Bureau of Labor Statistics, falls account for one-fourth of all reported injury claims. Incredibly, slips, trips and falls are also the second-leading cause of accidental death at work with about 16 fatalities per week (almost 850 per year). Only motor vehicle fatalities are higher. Just as defensive driving helps reduce the risk of vehicle accidents, defensive walking strategies, such as keep your eyes on the path, staying clear of objects and using the handrail, can be used to reduce the risk of falling.
Tripped and Fell
Trip-and-fall is a cause-and-effect relationship shown in Figure 1 (below). The question, “Why did the person fall?” is answered with “Because the person tripped.” The effect is on the left, the cause is on right, as is the convention on all Cause Map™ diagrams. The Why questions build the incident analysis backwards. The investigation starts with a negative outcome, then identifies what contributed to that unwanted result. The connector arrows point to the left indicating the cause occurs before the effect.
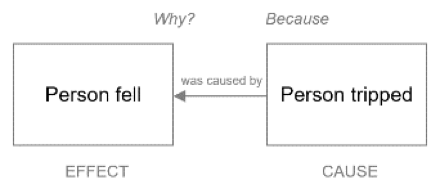 Figure 1. 1-Why
The basic analysis above is accurate, but not thorough. Continuing to ask Why questions will expand the analysis to whatever level of detail is needed to thoroughly explain what happened.
Tripped on a Step
Let’s look at a specific situation where a person tripped on a step resulting in a fall with an injury. During a review of the incident, the person who tripped said, “I didn’t even see that step.” The cause-and-effect relationship in Figure 1 can be expanded into the 3-Why below.
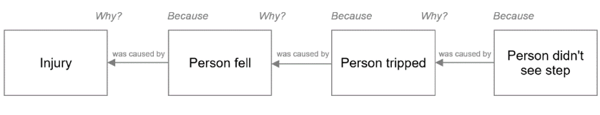
Figure 2. 3-Why
The labels “Why,” “Because” and “was caused by” are shown on this Map, but they’re not required when people are familiar with the method. The Map reads left to right with the phrase was caused by represented by the arrows between the boxes. The Map can also be read right to left by saying “which resulted in” or “which caused.” For example, the person didn’t see the step, which caused the person to trip.
3 Meanings of 'Tripped'
Avoiding misunderstandings is an important part of explaining and preventing problems. Sometimes, an issue can be made clearer by adding detail. The definition of the word “tripped,” according to Google, is to catch one's foot on something and stumble or fall. There are three different cause-and-effect relationships in that definition. 1) The person stumbled 2) because they caught their foot on the step, 3) which resulted in the fall. Those causes and effects lay out in a Cause Map diagram like this:
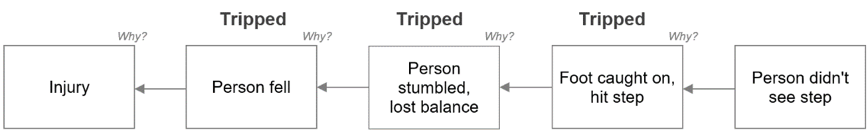
Figure 3. 4-Why
In the example above, the word “Tripped” is written above each of the three different meanings for the sake of this example. Tripped doesn’t need to be broken out this way each time, but it can be, if needed. This same approach of breaking down cause and effect applies to the problems you’re investigating—safety incidents, equipment failures, production losses and operational errors. The objective isn’t to add as much detail as possible, it’s to add as much as needed to understand the issue and find effective solutions.
Finding More Options to Reduce Risk
The straight-line cause-and-effect analysis above can be expanded into parallel paths. Just because you stumble and lose your balance doesn’t mean you will fall. If you’re able to regain your balance you can avoid the fall.
This is where the role of a handrail can be helpful. A person can lose their balance but remain stable if they use the handrail. Adding detail in the investigation will reveal different options to mitigate risk. The straight-line analysis in Figure 3 is accurate, but it’s not complete. The 6-Why below has more detail, but it’s still not complete.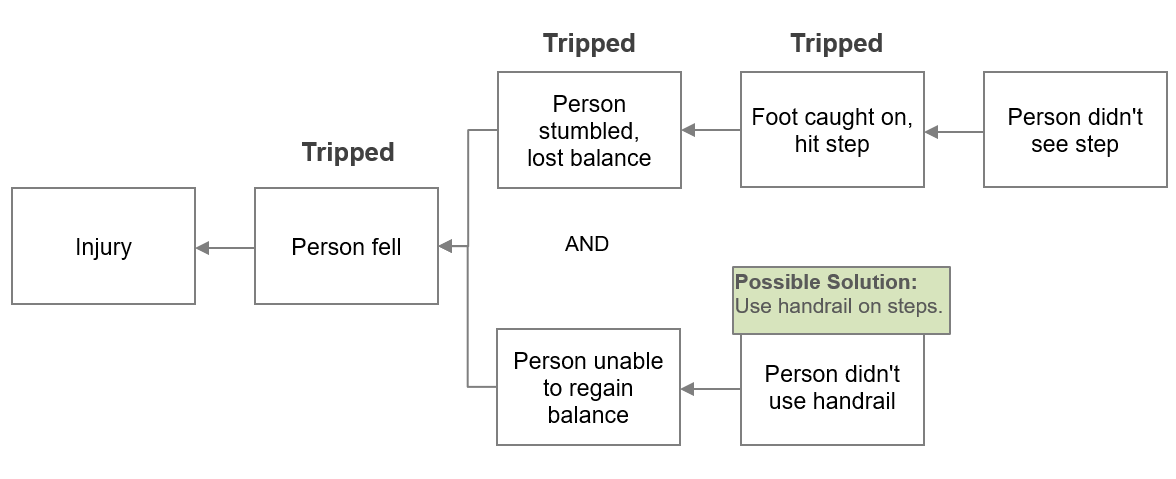 Figure 4. 6-Why with a Parallel Path
Eyes Not on the Path – Adding Other Causes
There are two Maps in Figure 5: a 4-Why and a 10-Why. Both start with the safety goal being adversely affected. The 4-Why is a simple analysis. The 10-Why is a more detailed explanation. Both Maps are accurate. Several different possible solutions are shown in green above the cause they’d control. Several of the solution options shown on the 10-Why are not obvious in the 4-Why. Adding more detail during an investigation naturally expands the range of possible solutions that are considered. This is one of the advantages of adding detail to your investigations.
Notice, for contact between a foot and a step, it requires the foot to be in a specific location and the step to be in a specific location. If the foot is raised a little higher, then the step isn’t hit. If the step is not in that area, the foot doesn’t hit it. The causes in the 10-Why show that the person’s foot is at that specific location because they didn’t the see step, and they were taking that path. If they were aware of the step and lifted their foot slightly, the person wouldn’t have tripped on that step. This is the benefit of keeping our eyes on the path where we’re walking—to be aware of a step. If the person had taken a different route, the step could be avoided altogether.
The details are already inside every incident. Your investigation reveals those details. The Cause Mapping® method allows the investigation to begin very basic then expand as needed. The details aren’t necessary for every issue, but they’re available if an organization wants to dig into them.
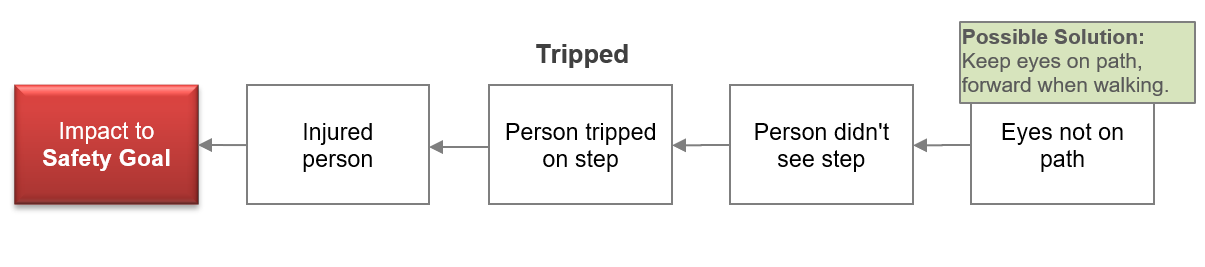
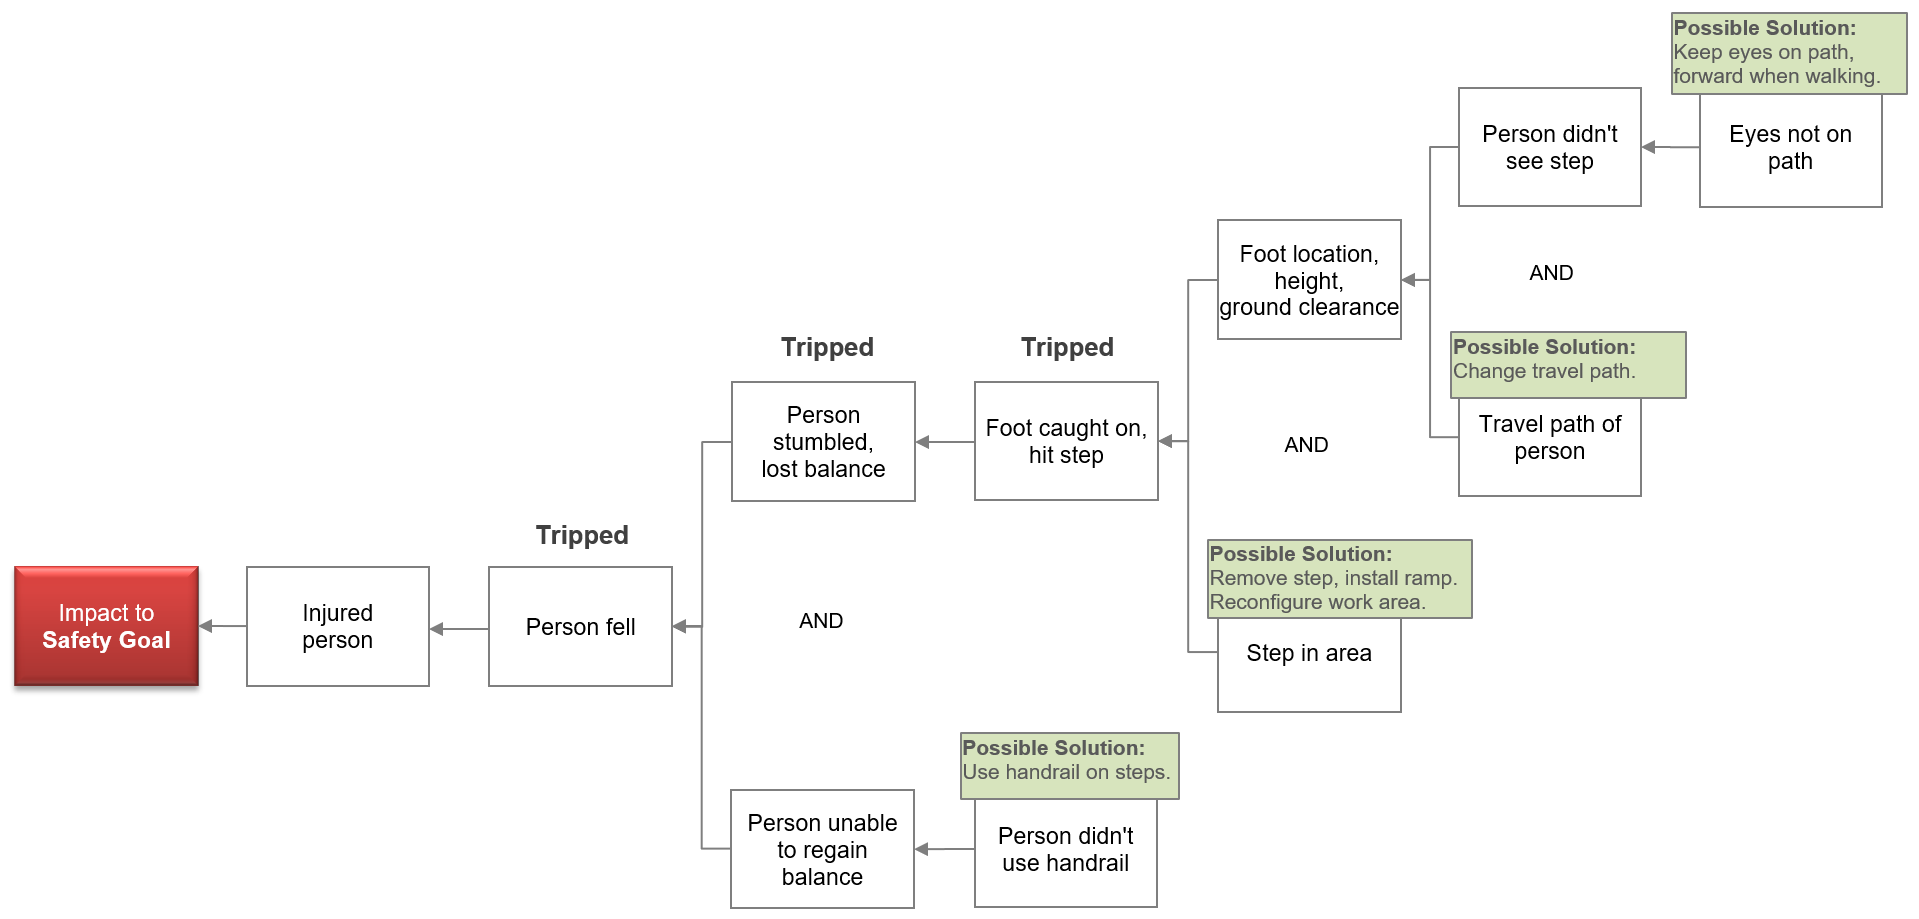
Figure 5. Simple 4-Why and a more detailed 10-Why Cause Map diagram
Because all of the causes were required to produce the issue, all of the causes don’t have to be solved. Changing just one cause reduces the risk of the incident. By changing more than one, also known as layers of protection, risk can be made even lower. Just like the combination of antilock brakes, crumple zones, seat belts and air bags produce a cumulative reduction in risk in automobiles.
Test This Approach
The problems in your organization may be more complex than tripping on a step, but the approach can be applied the same way. Break down the cause-and-effect relationships within your problems by asking and answering one Why question at time. With the Cause Mapping method of root cause analysis, a problem investigation can begin with one or two cause-and-effect relationships in a straight-line. From that simple start, the analysis can be expanded into as much detail as needed – like this fall example. Learning to diagram your problems with a Cause Map diagram provides a structured, systematic way to dissect, document and communicate issues.
More Resources
To learn more about developing cause-and-effect analysis skills in your organization, visit our website to find examples and register for our free weekly webinars. You can also develop your skills by attending one of our workshops in a city near you or hosting a workshop at your site, just contact our office directly if you have questions or would like additional information.


