Most root cause analysis (RCA) investigations focus on incidents that cause tangible problems, but near misses—events that almost result in an incident—are also worth investigating. In fact, many companies are now requiring formal investigations for high potential (HiPo) incidents and serious injury and fatality (SIF) potential events.
Investigating near-miss events helps identify potential risks, prevent future incidents and improve safety. In this blog, I’ll show you how to document near misses with the Cause Mapping® template.
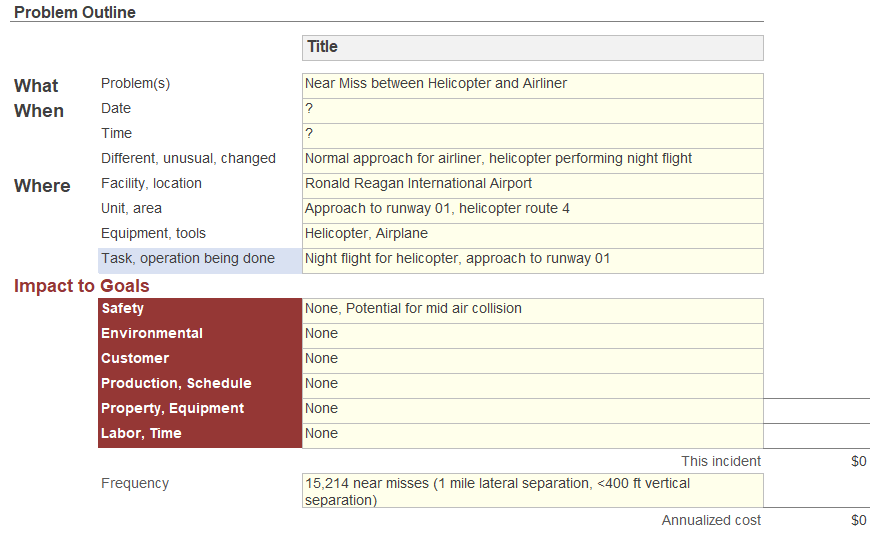
Filling out the Problem Outline for a Near Miss
Let’s start with the problem outline, focusing on the Impact to Goals section. For a near-miss event, you can use this section to capture both:
- What did happen—the actual impact to one or more of the organization’s goals
- What could have happened—the potential impact if the near miss had turned into an incident
When documenting near misses, I start by writing “None” to make it clear that no goal was actually impacted. After “None,” I typically add “Potential for…” to capture what could have happened.
Let’s see how this works, using a near miss at Ronald Reagan Washington National Airport (DCA) as our example. For simplicity, I’ve kept it generic and left question marks on the date and time fields. For the Safety goal, I’ve written: “None, Potential for mid-air collision.” For frequency, I’ve utilized data on near misses at DCA from the NTSB’s preliminary report1.
DCA Near Miss Problem Outline
Analyzing a Near Miss—with a Secret Weapon!
In any investigation, we’d begin our analysis with a 5-Why that builds backward from an impacted goal. But when you’re investigating a near miss, there is no impacted goal. So, what should you do?
The first and most obvious way to approach this is to use the red goal box that’s already included in the Cause Map™ worksheet, as I’ve done in the example below. I added Safety to the goal box, then filled in the first cause box with the information from the Problem Outline (“Potential for mid-air collision”). From here, I’ve continued the analysis as I normally would, asking four additional Why questions to build a 5-Why.
DCA Near Miss 5-Why Analysis (Option 1)

From this point, I’d continue expanding the Cause Map diagram as I would in any investigation.
Using the standard red goal box and indicating that no goals were impacted by writing “potential for” in the first cause box is a good way to analyze a near miss. But I think there’s a slightly better way to do it. It’s time to bring out the secret weapon!
In the Spare Parts worksheet in the Cause Mapping template, there is a hidden gem that will forever change how you present your investigations: the yellow near-miss box. Below, I’ve used the yellow near-miss box to build the same 5-Why as before. As you can see, it totally transforms the look of the Cause Map diagram.
DCA Near Miss 5-Why Analysis (Option 2)

The yellow near-miss box doesn’t just look cool, it also makes your Cause Map diagram clearer. The yellow goal box is like a caution sign or a yellow traffic light, communicating that a goal was almost impacted. This visual distinction is especially useful in investigations that include both near misses and actual negative impacts for example, a fire broke out in the warehouse, and everyone evacuated safely (near miss), but production had to but shut down for the day (actual negative impact).
Notice also that I’ve highlighted “potential for” in bold yellow in the first cause box of the 5-Why above. Like the yellow near-miss box, this acts as a helpful visual cue to indicate which causes could have happened and which ones did happen. This distinction is critical when you get to the solutions stage.
Evaluating Solutions for Near Misses
When you get to the solutions stage, it’s important to remember that applying a solution to a cause that only had the potential to occur won’t reduce the risk of the event happening in the future. For example, in the 5-Why above, adding a solution to “Potential for a helicopter to hit an airplane" wouldn’t actually prevent future collisions or what led to the near miss. But applying a solution to “Helicopter in close proximity to airplane”—such as adjusting flight routes or altitude separation requirements—would likely reduce risk.
In larger investigations that include both near misses and actual negative impacts, this distinction helps prioritize solutions. Consider the example of a fire in a warehouse that was quickly extinguished. No people were harmed, and no equipment was damaged, but production was delayed. A solution-focused only on the near miss—such as adding more fire-resistant materials—might be beneficial but wouldn’t prevent the disruption. However, a solution addressing what actually happened, like improving emergency response procedures, would directly reduce the risk of future production delays while still supporting overall safety improvements.
Don’t Miss the Opportunity to Improve
Not every near miss requires an exhaustive investigation, but taking the time to document and analyze them—even at a basic level—can drive meaningful improvements. Our free Cause Mapping template makes it easy to investigate near misses efficiently and effectively, without confusing jargon or expensive software.
The real question isn’t whether a near miss is worth investigating. It’s whether you’re willing to leave safety and reliability to chance.