We may not be able to celebrate with extravagant holiday parties and large gatherings of family and friends this year, but one thing we can do is decorate. Many of us, myself included, are going big with the decorations to bring a little more joy to 2020. I’ve got a live Christmas tree, stockings by the fireplace and lights on my house that the Griswold family would appreciate.
But as many of us break out the ladders and step stools, we’re facing risks to our safety. According to the U.S. Consumer Product Safety Commission, on average, there are about 200 decorating-related injuries each day during the holiday season, with about half of those incidents involving falls. And in the 2018 holiday season, about 17,500 people were treated in emergency rooms due to holiday decorating-related injuries.
We can begin to understand holiday decorating mishaps like falls by building a Cause Map™ diagram. By analyzing an incident of a person falling while hanging lights and understanding its causes, we can take preventative measures to avoid being part of that sobering statistic for 2020.
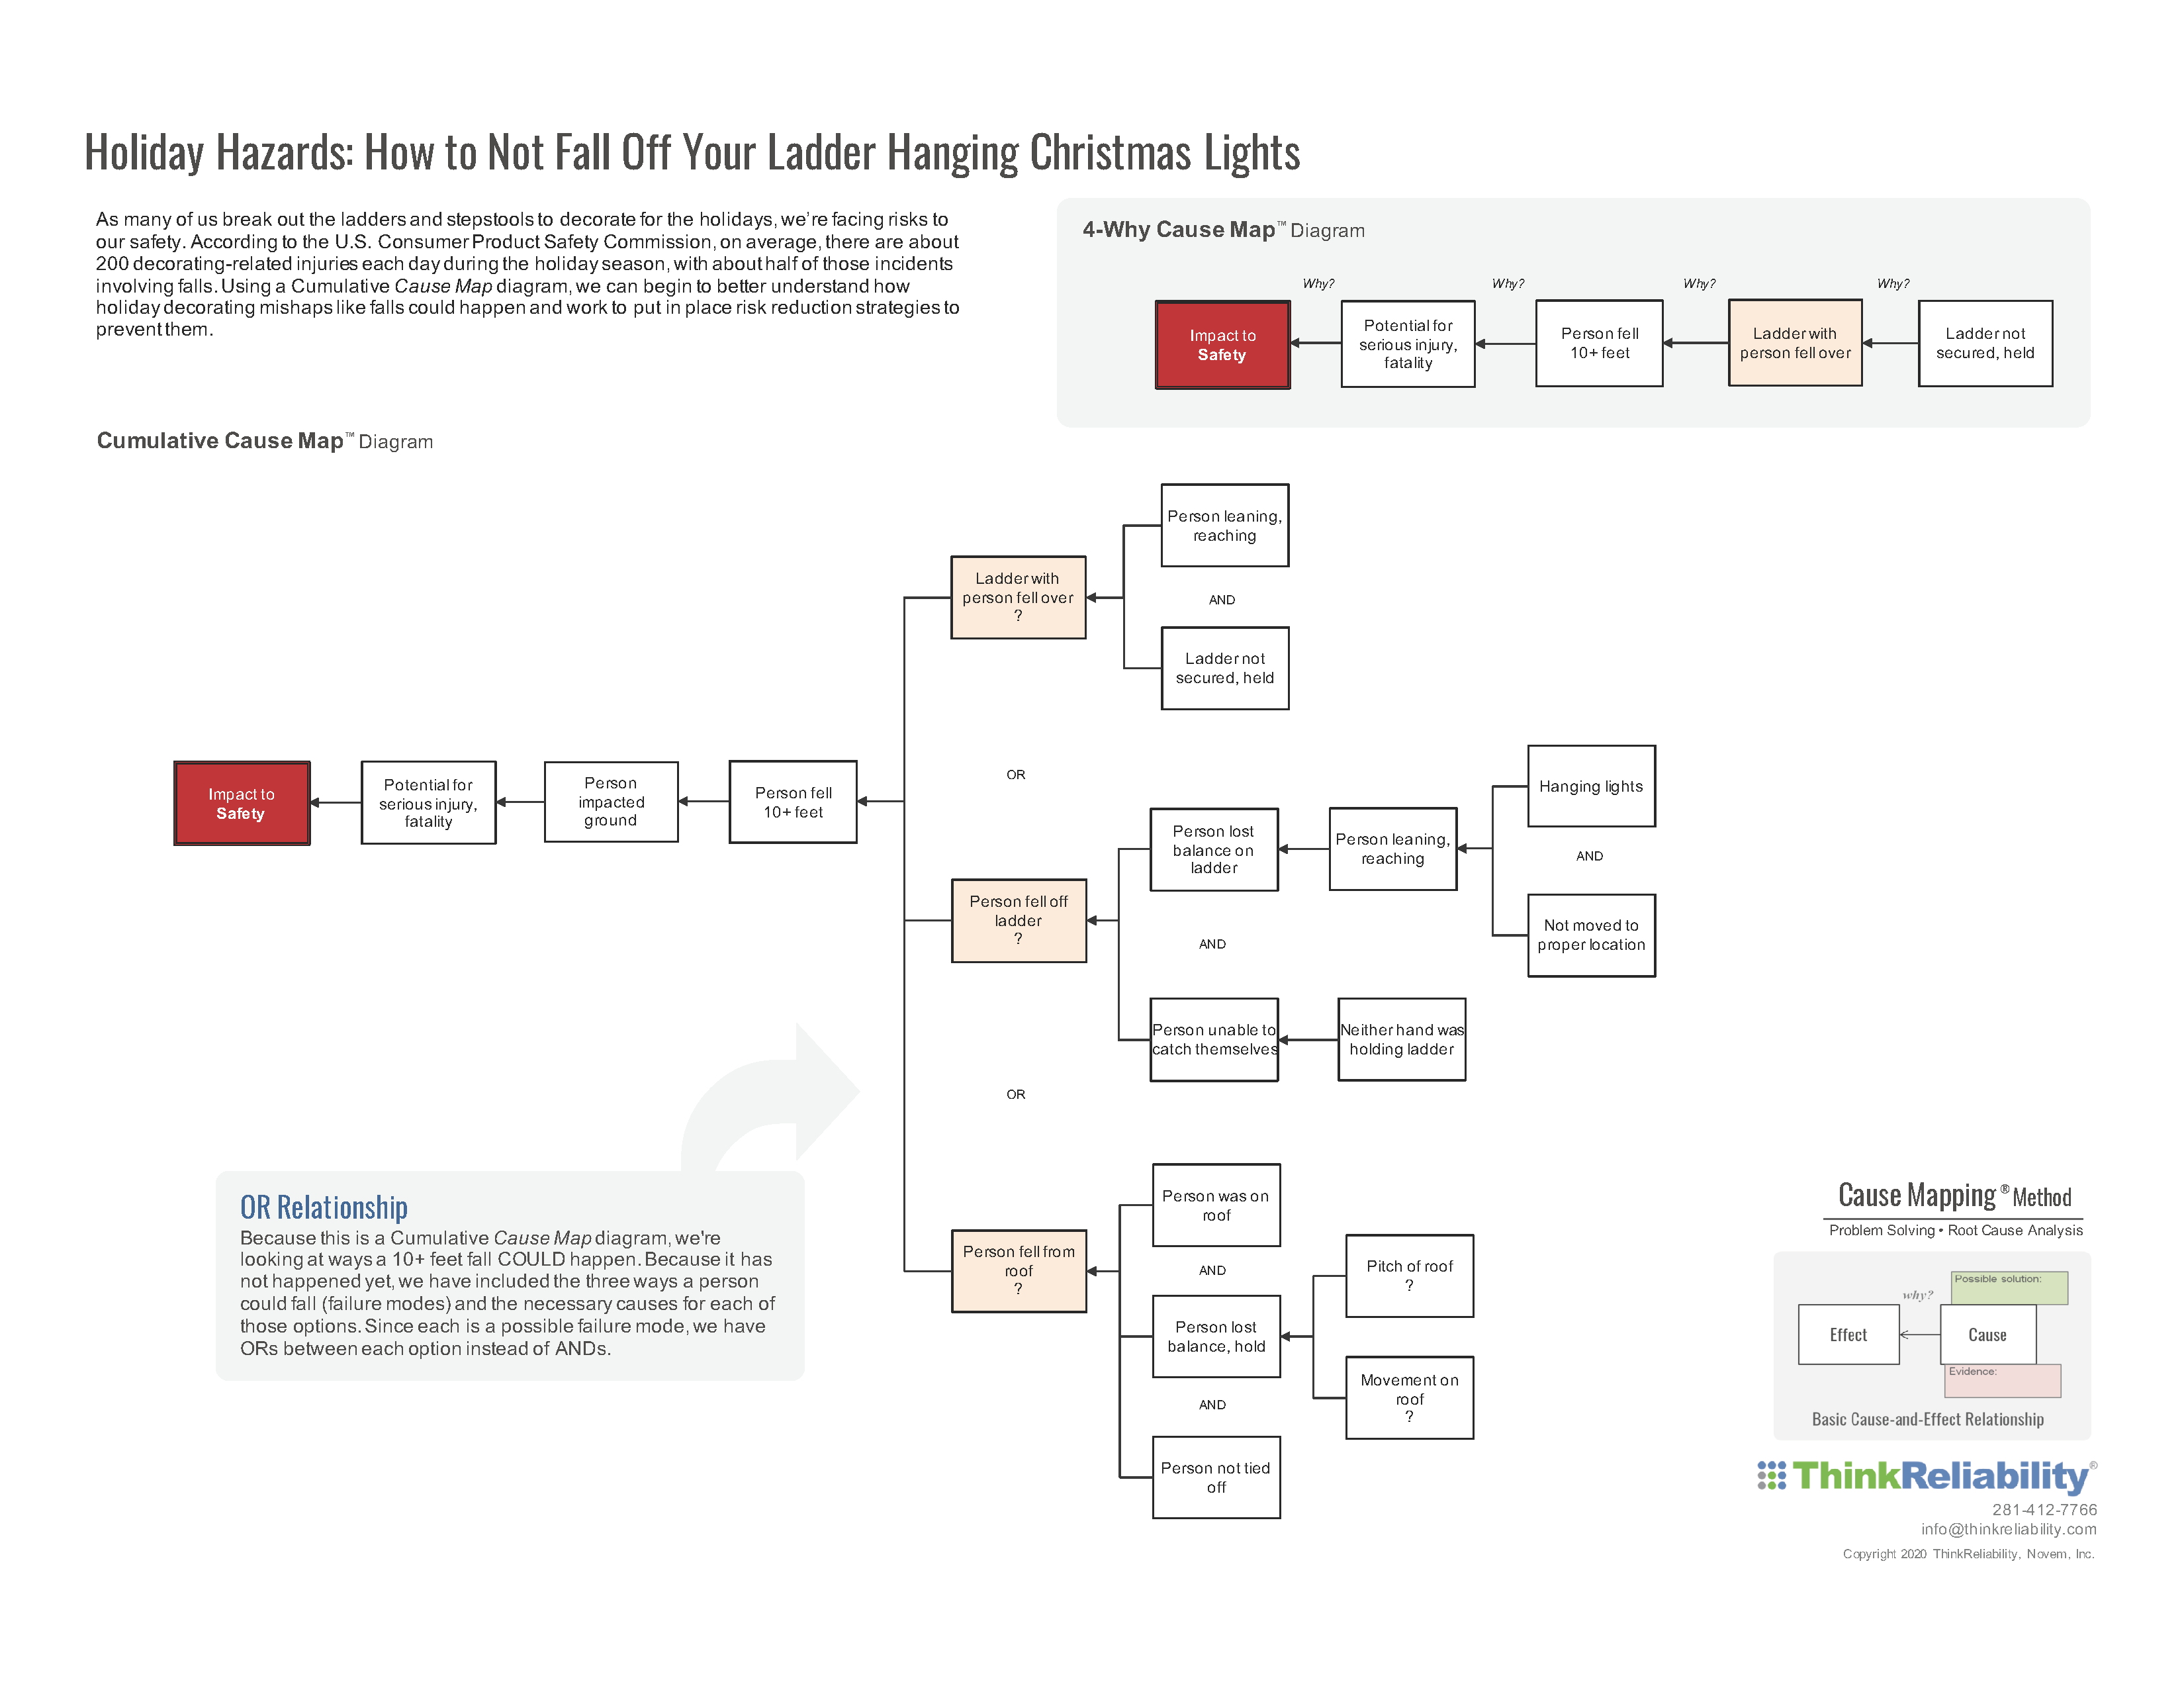
Taking this example, an initial 4-Why cause-and-effect relationship might look like this:

There was potential for serious injury or fatality because the person fell more than 10 feet because the ladder with the person fell over because the ladder was not secured.
As we continue to think through the possibility of a fall while hanging lights, it becomes evident that the height at which you fall is important. Falling from a step stool and falling from the second story of a house present different risk factors. There are two types of fall injuries: falls to the same level and falls to a different level. In 2018, there were 320 falls to a lower level out of 1,008 construction fatalities. That’s nearly one per day just within the construction industry. Whether you’re investigating a fall at your job site or a fall while hanging your holiday decorations, you can reduce the risk of a fall ever occurring by investigating using Cause Mapping.
Building a Troubleshooting Guide for Falls
For this example, let’s say we’re looking at how a person could fall while hanging Christmas lights. They can fall over, fall off of the ladder or they can fall off the roof. These different ways the incident could happen, whether it’s falling while hanging lights or an equipment failure at work, are called failure modes. If you document these failure modes using what you've learned in a Cause Mapping workshop, you’re building a troubleshooting guide called a Cumulative Cause Map diagram.
To do so, we ask Why questions to better understand how those various types of falls happen. What causes are required for each type of fall from a ladder? By knowing those failure modes, we can better mitigate the risk of a fall happening. And if a fall does happen, we are prepared to better understand why the person fell and put additional risk mitigation strategies within the work process to prevent a similar incident from occurring again.
Revealing Risk Mitigation Opportunities
The point of building out the Cumulative Cause Map diagram with more details is to reveal additional solution options. For example, if the height of the fall isn’t included on the Map, then the possible solution of adjusting the height isn’t identified. The added details add opportunities for risk mitigation—for each of the possible failure modes.
Click on the thumbnail below to view and download the initial Cumulative Cause Map diagram for the three ways a person could fall while hanging lights.
By knowing the causes of a fall, we can work to put in place risk reduction strategies to prevent a fall from happening this holiday season. For more information on ladder safety, you can see OSHA’s Portable Ladder Safety tips here.
We wish you a happy (and safe) holiday decorating experience this year!


