Editor’s Note: This blog is the second part of a two-part series. View Part 1.
An intense heat wave devastated Europe this past summer. Over a three-month period, more than 20,000 people are estimated to have died from conditions caused or worsened by the severe heat. In Part 1, we defined the 5-Why Cause Map™ diagram and its importance in problem-solving. We also illustrated how two different people – both with different perspectives – could approach creating a 5-Why Cause Map diagram.
Person 1: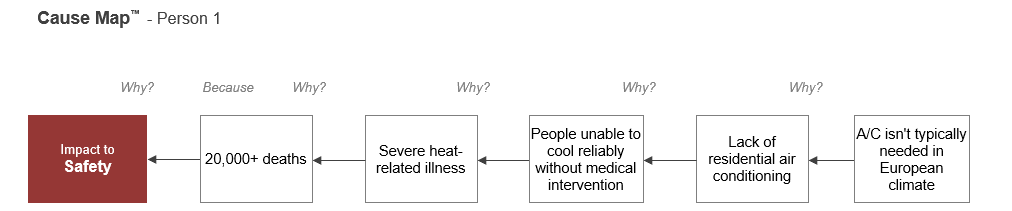
Person 2: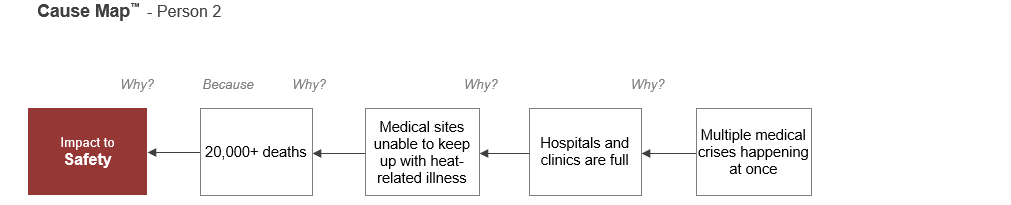
Combined 8-Why: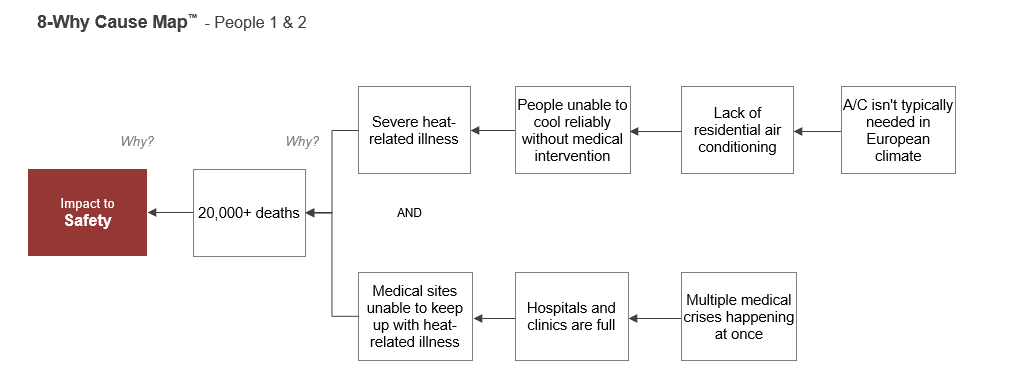
With each simple diagram collected, more potential solutions will surface. Take, for example, adding a third and fourth perspective.
Person 3: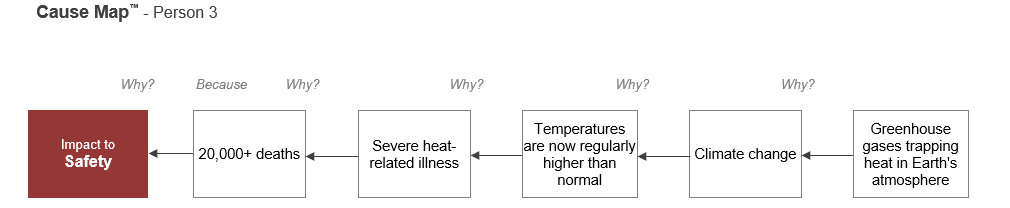
The third person’s Cause Map is centered on climate change-related causes. Like the others, this map starts with the number of deaths caused by severe, heat-related illnesses. Why? Average temperatures are higher than they ever have been. Why? Impacts from climate change. Why? Greenhouse gases are trapping heat in the Earth’s atmosphere.
Solutions might include things like creating devices that help people survive extreme heat, reducing or eliminating emissions, or scrubbing air to clean greenhouse gases.
Here is what an expanded 11-Why Cause Map diagram that combines all three perspectives might look like: 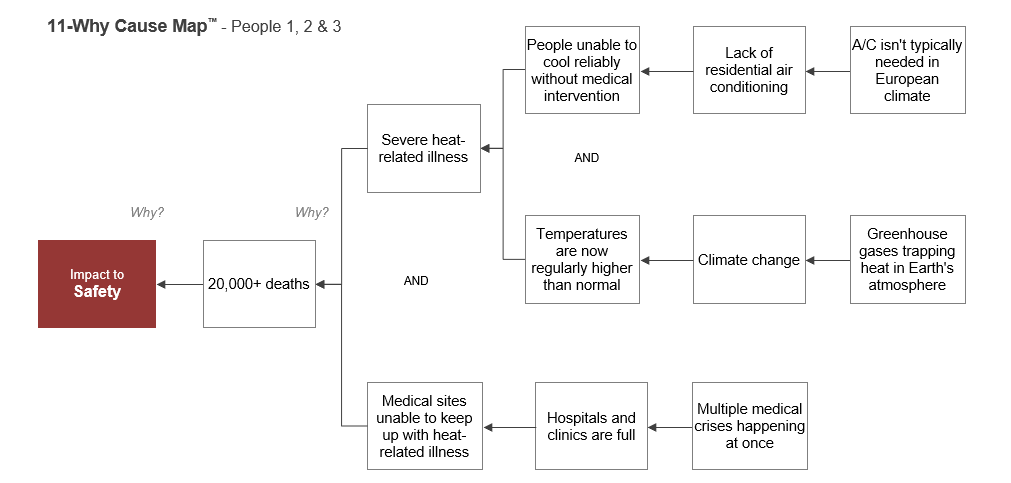
A fourth person might also use higher average temperatures as a catalyst, but they could have a different perspective, such as natural fluctuations in global temperatures caused by natural changes in the Earth’s reflectivity. A solution could be to artificially regulate reflectivity.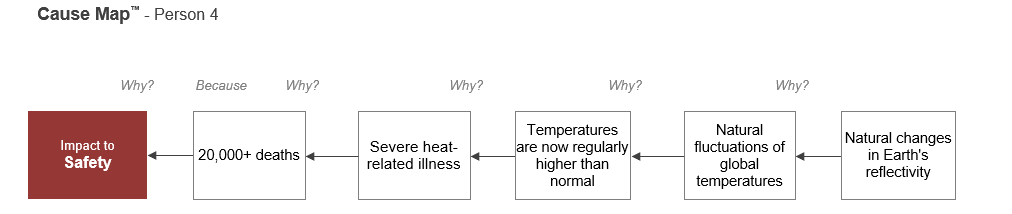
The maps of all four people combine to create a 13-Why Cause Map diagram: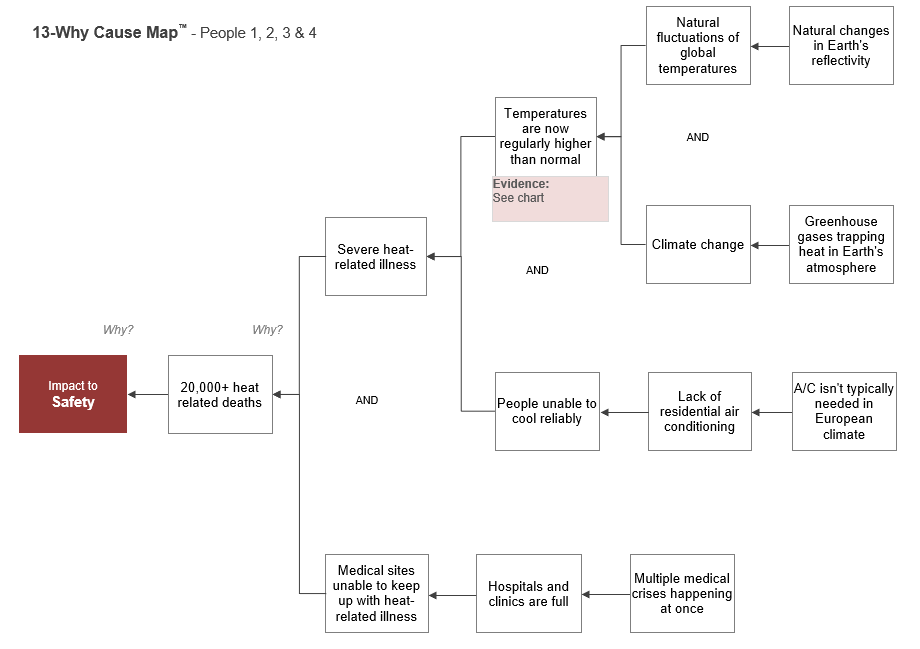
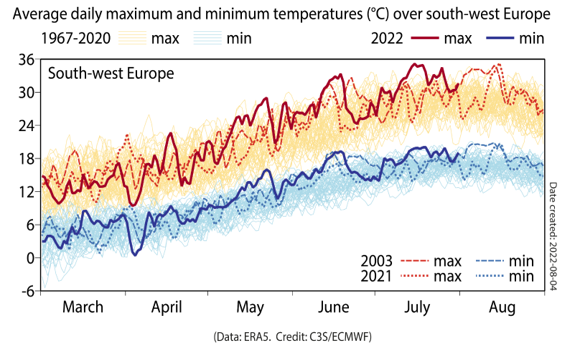
This is what the Cause Map diagram would look like with evidence (red boxes) and solutions (green boxes) added: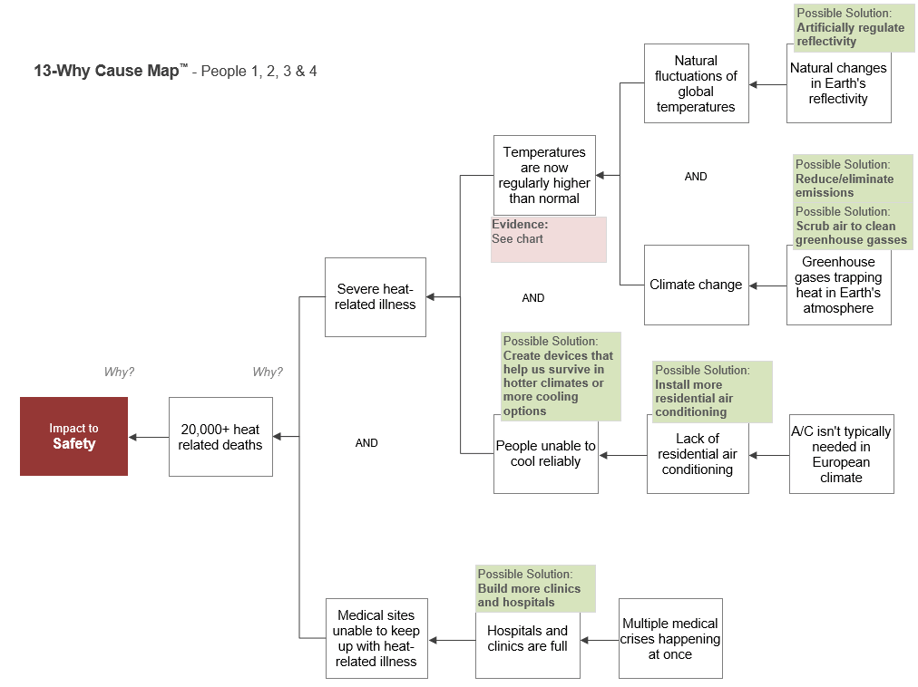
With each new, differing perspective, more potential solutions emerge. The above map was created with only four people’s simple diagrams. Each person’s point of view can add a unique and different set of solutions that helps an organization most effectively address a problem.
Are You Intrigued About How This Method Could Work for Your Organization?
Join our upcoming 5-Why Cause Mapping Root Cause Analysis online short course to learn how to apply cause-and-effect thinking to break down any problem, as well as how to avoid problem miscommunications, the role of evidence, critical thinking basics and more.