
Lessons to Mitigate Risk Within Your Operations
Stairways are found in many places, and chances are that at some point in your life, you’ve stumbled and fallen on a set of stairs. Falls on stairs are common, injurious, and represent a disproportionately high risk for mortality or for a major injury, such as a traumatic brain injury or a hip injury, according to an article published in ScienceDirect1. In fact, more than a million people are treated in US emergency departments each year for stair-related injuries. Yet the risk of these mishaps can be reduced significantly.
We’ve made several Cause Map™ diagrams to show how digging into the specifics of an issue expands your options for prevention and reduces the risk of a stairway fall that leads to an injury.
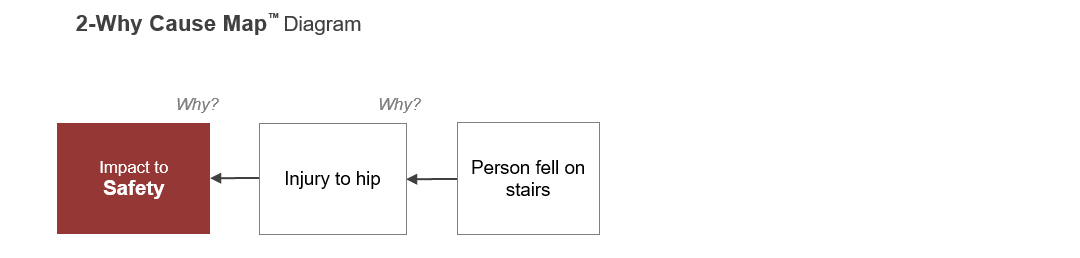
Start Simple
With a basic, 2-Why Cause Map diagram, you can see that the safety goal was affected because of a hip injury. Read the Cause Map diagram by asking “Why?” after each effect and “because” for each connector arrow to the right. For example, why was there an injury to the person’s hip? Because they fell on the stairs.
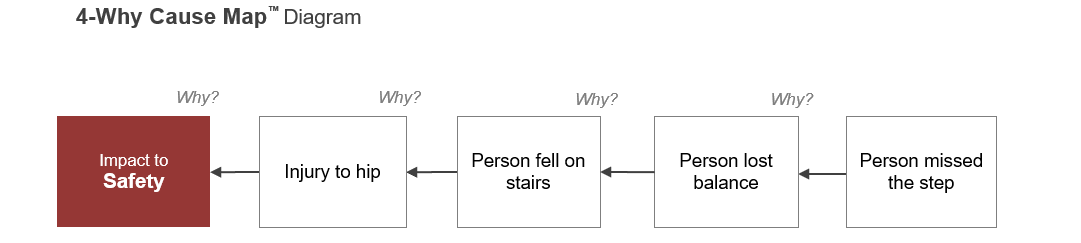
Expanding the Cause Map™ Diagram to Reveal Solutions
The 2-Why is accurate, but it’s missing information. By adding detail, additional causes are revealed to provide more solutions. Below is a linear, 4-Why Cause Map diagram with two more causes. Why did the person fall? Because they lost their balance. Why did they lose their balance? Because they missed the step.
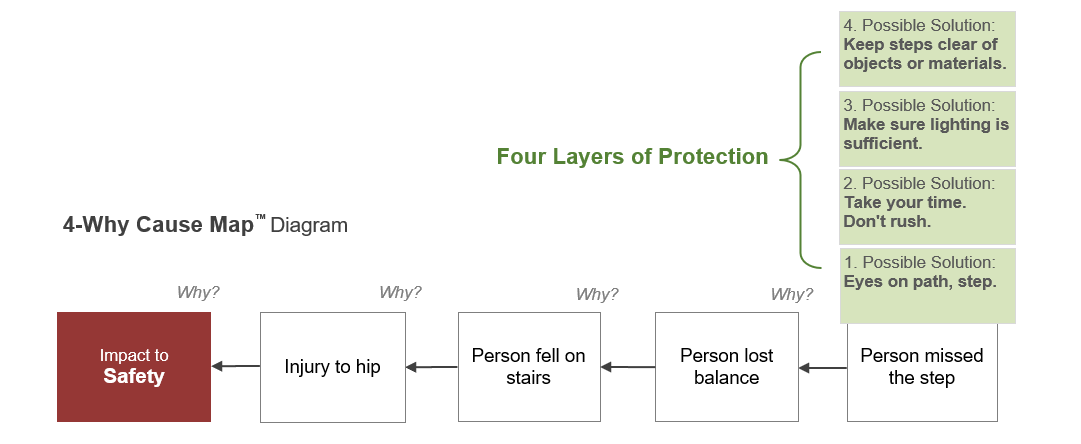
To reduce the risk of missing the step, there are several actions that can be taken. Here are four best practices for stair safety:
- Keep your eyes on the steps and try to avoid distractions.
- Ensure you’re taking your time and not rushing.
- Make sure the stairway is well-lit so you can see where you’re stepping.
- Ensure the steps are clear of objects or materials that you have to step around.
These four solutions are also known as “layers of protection.” On a Cause Map diagram, they are placed directly above the cause they control. This linear causal path could be expanded further by asking another simple question: Why did the person miss the step?
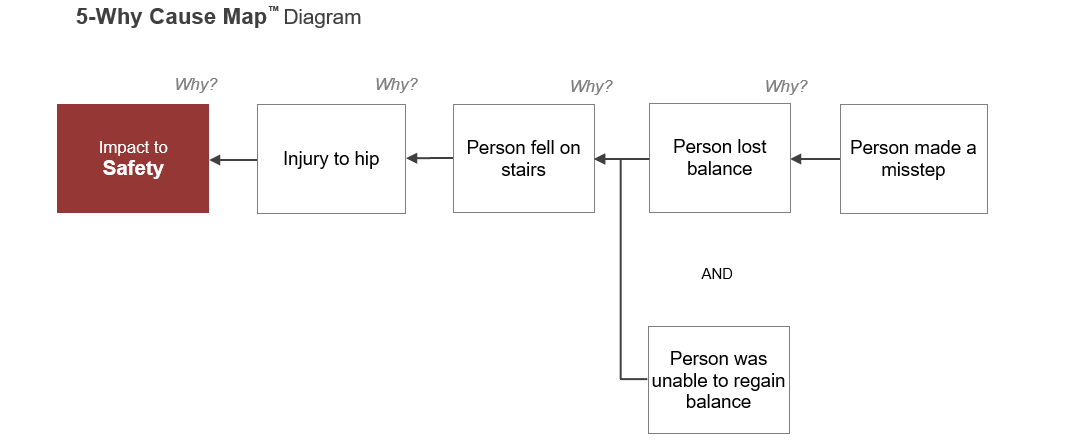
Adding a Parallel Path
The 4-Why Cause Map diagram can also be expanded into a 5-Why with a parallel path. The person fell because they lost their balance, but that wasn’t the only cause. The person was also unable to regain their balance after losing it. It’s important to note that both of these causes had to happen for the fall to occur.
Because both causes are required for the injury to occur, solving either cause changes the effect. A person can lose their balance on the stairs, but not fall if they control one of the causes.
Recognizing these parallel causal paths within an incident provides a significant opportunity to mitigate risk within an organization’s operations. Even if one causal path happens, the effect can be avoided if you control another one. You don’t need to interrupt all of the causal paths to prevent the incident; you only need to control one. This is precisely how layers of protection mitigate risks.
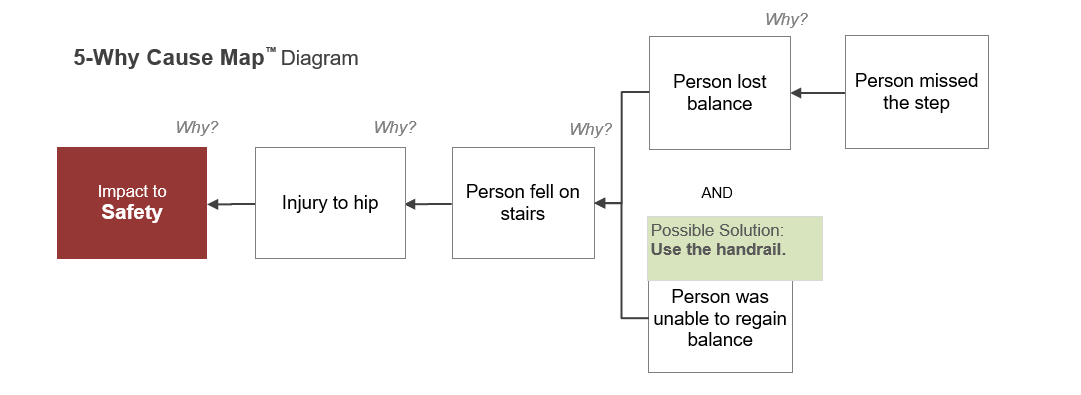
Using the handrail is a contingency. If someone does lose their balance, we may still be able to prevent the fall. Other missteps can be handled with this same handrail logic:
- A vessel overpressures, but it doesn’t explode because the safety valve opened at a pressure that was below the operating limit.
- A quarterback can’t find an open receiver downfield, so he throws the ball to what’s known in football lingo as his “safety valve” – the uncovered running back who has moved to an open area of the field.
- During launch, the first state of a rocket begins to malfunction. The launch escape system immediately fires, separating the crew module from the troubled first stage and propelling it to an altitude where parachutes can set it gently back down to earth. The rocket explodes, but the crew survives.
- An electrical system experiences a voltage surge, but rather than damaging the susceptible equipment, an inexpensive fuse was designed and added into the circuit to fail instead.
- There’s a miscommunication between the airport traffic control tower and a pilot, but because messages are repeated back, the misunderstanding is caught and immediately corrected.
All five of these examples can be shown as a straight-line, linear, analysis that produced an undesirable effect. But by revealing the parallel path within the incident, a metaphorical handrail can be added to change the outcome.
Recurring problems are symptomatic of a poor problem-solving culture for an organization. In our Cause Mapping workshops, individuals and organizations learn how to dig into their problems to find these parallel paths. A linear problem-solving model limits the analysis and artificially restricts the solution set.
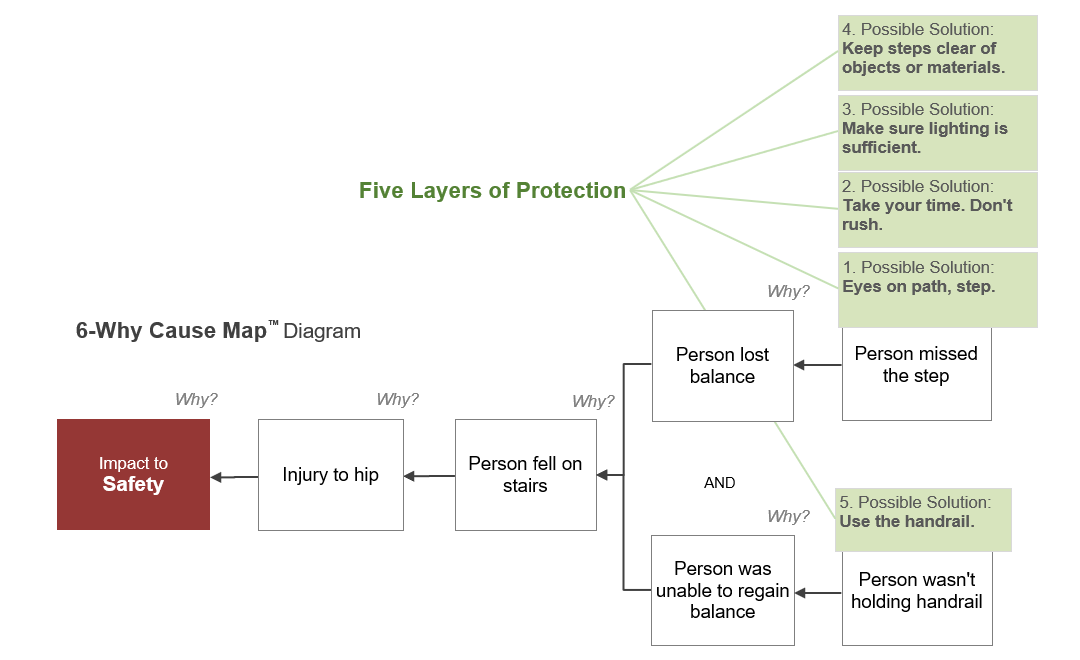
A 6-Why With Solutions for Only Two Causes
This 6-Why Cause Map diagram shows the parallel causal paths and the five different layers of protection. Even if the first four measures still result in someone losing their balance, the fifth layer — using the handrail — can still prevent the fall.
Because you don’t know when you might lose your balance, keeping a hand on the handrail every time you use the stairs reduces the risk of falling. This will typically prevent you from carrying too much at once, as one hand needs to be reserved to hold the handrail.
Use a Straightforward Approach to Explain and Solve Your Problems
The better you get at uncovering the details contained within your problems, the more options you’ll have to mitigate risk. The objective isn’t to add as much detail as possible. Instead, it is to only add as much as you need to meet your organization’s operational goals.
Cause Mapping® root cause analysis is a simple application of the cause-and-effect principle to reveal a system of causes within an incident. By identifying these causes, you can take steps to mitigate risk, no matter how complex the problem.
Downloads and Short Courses Can Help
Download our free Cause Mapping template in Microsoft Excel to begin practicing on your own problems, from common annoyances to those repeat issues that are affecting your operations. You can also check out some of our detailed case studies.
Learn more about applying cause-and-effect thinking in your organization by enrolling in an upcoming short course or workshop.

1https://www.sciencedirect.com/science/article/pii/S0966636216301096#bib0035


