We’ve all heard the phrase, “Correlation does not imply causation.” It’s an old adage, and a true one. Correlation is an association between two things. Causation is when one thing causes another thing to happen. Of course, if one thing causes another to happen, those two things are associated. Causation always implies correlation, but again, correlation does not imply causation. To put it simply, it’s like how every square is a rectangle, but every rectangle isn’t a square.
When you’re investigating an incident, mistaking a relationship that is merely correlated for one that is causal—even once—can nullify your findings. In this blog, you’ll learn how to avoid this common error with Cause Mapping® root cause analysis.
Let’s start with a popular example from mathematician and science journalist Ionica Smeets. In her TED talk, Smeets presents a chart showing that when ice cream sales increase, so do drownings.
Ice Cream Sales and Drownings
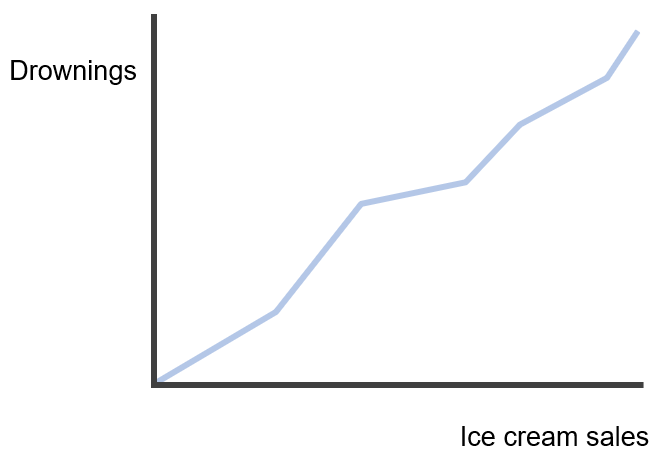
“I think it’s very safe to conclude from this that we should ban ice cream because it’s very dangerous,” jokes Smeets. The audience laughs because this conclusion is clearly wrong. We can easily identify what Smeets calls the “underlying factor” of the increases in ice cream sales and drownings, which is warm weather. When temperatures rise, people buy more ice cream. When temperatures rise, more people go swimming and—unfortunately—some of those people drown.
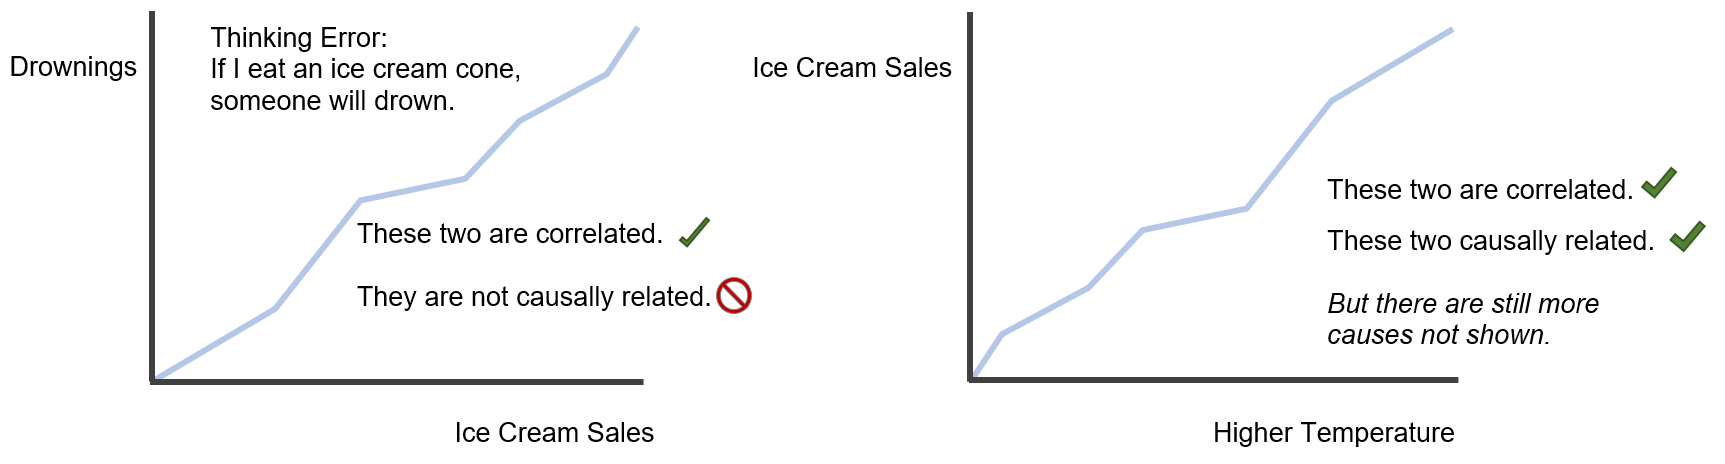
Ice Cream Sales and Drownings—Correlation vs. Causation
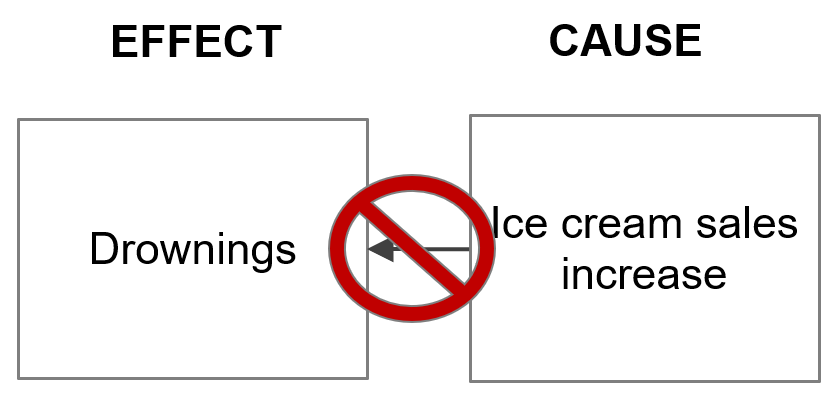
We can use concepts taught in Cause Mapping workshops to illustrate this logic. If we follow Smeets’ chart and don’t think through the evidence, we get the incorrect 1-Why below.
Incorrect Ice Cream Sales and Drownings Cause Map™ Diagram
But we know that the effects “ice cream sales increase” and “drownings” are both produced by the same underlying cause, “higher temperatures in summer.” We illustrate this with the correct Cause Map diagram below.
Correct Ice Cream Sales and Drownings Cause Map Diagram
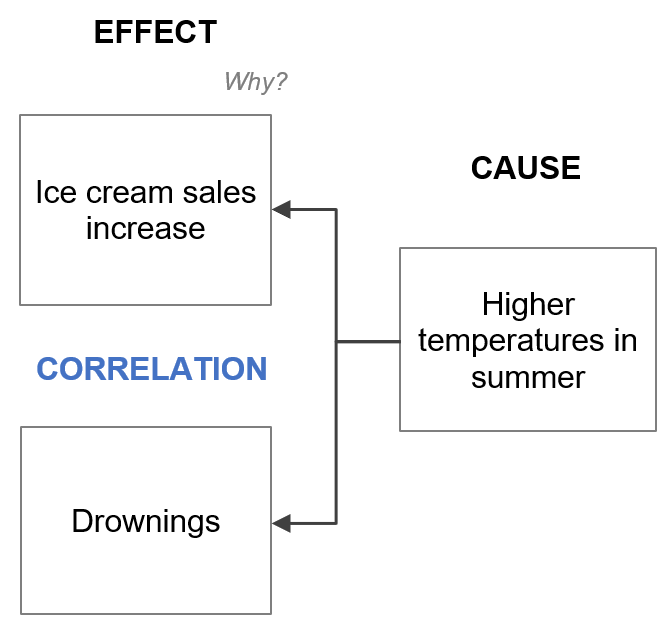
We draw an arrow from “higher temperatures in summer” to “ice cream sales increase” because this is an accurate causal relationship. We also draw an arrow from “higher temperatures in summer” to “drownings” because this is also a correct causal relationship. But there’s no arrow between ice cream sales and drownings because there is no causal relationship between the two. They’re merely correlated.
Detail Adds Clarity
“Increased ice cream sales are caused by higher temperatures in summer” is an accurate statement, but it’s not a very effective explanation. It’s a partial explanation. Partial explanations often lead to distorted conclusions. For example, if you observe that the middle of the Sahara Desert has very high temperatures and conclude that ice cream sales will increase there, your conclusion will likely prove incorrect. We’re missing some key details, like the presence of people and ice cream.
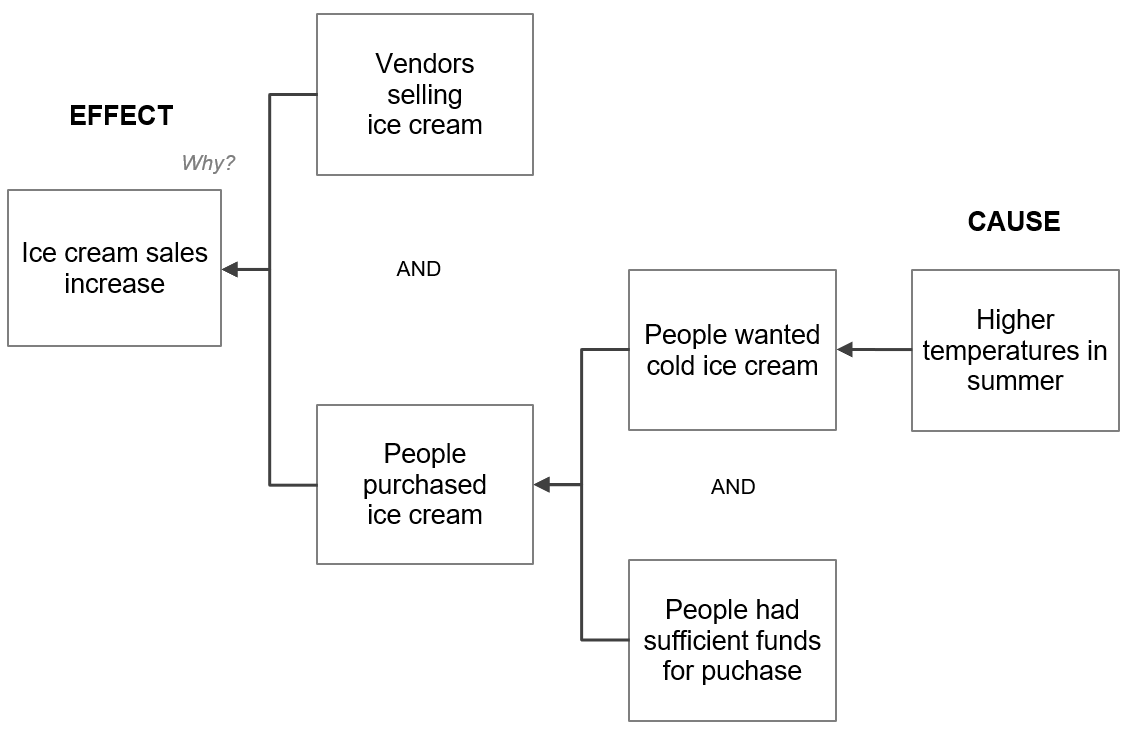
Whether you’re explaining how something happened verbally, or explaining it visually with a Cause Map diagram, you need sufficient detail to explain how all the different factors contributed to the outcome. The diagram below provides a more thorough explanation of why higher temperatures are one of the causes of increased ice cream sales. It’s more detailed, it’s more complex, and it’s a much clearer explanation.
Detailed Ice Cream Sales and Drownings Cause Map Diagram
Learn How to Bring Clarity to Your Analysis
Just because two effects move in the same direction—like increased ice cream sales and drownings—doesn’t mean one causes the other. It takes a bit of digging to uncover the cause-and-effect relationships within any phenomenon. To learn more about how Cause Mapping can help you accurately and thoroughly understand and prevent your problems, check out one of our public workshops.