Hand injuries are among the most common on-the-job injuries, sending one million workers to the emergency room each year. There is a wide range of cost-effective and even cost-free measures to prevent these injuries, so why do they keep happening?
When an occupational hand injury strikes, instinct drives us to seek a sole culprit: a faulty tool, an individual misstep, or a unique circumstance. This narrow focus results in incomplete risk reduction. Instead, consider a broader lens—one that explores multiple causes, not just one. By investigating multiple causes with Cause Mapping® root cause analysis, you and your team can identify multiple solutions to build a comprehensive defense against future incidents.
Fundamental Relationship: Contact
All hand injuries share a common cause-and-effect relationship: contact. Whether the injury is a chemical burn, a crushed finger, or a simple paper cut, there is always contact between the hand and a hazard — the chemical, the hammer, or the paper. But why did this specific injury incident occur? To answer that, we’ll need to build a Cause Map™ diagram.
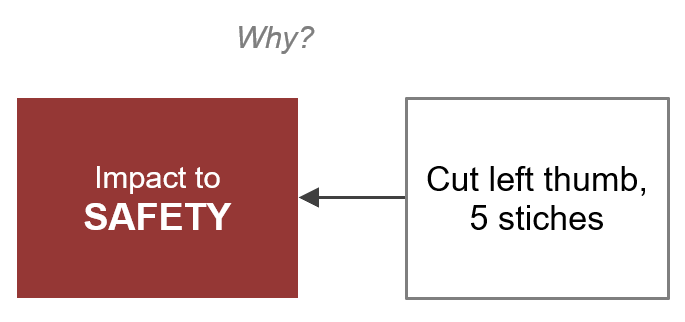
Let’s walk through an example incident: a person cut their hand with a utility knife while opening a cardboard box. The first step is to identify the specific negative consequence of the incident. A Cause Map diagram starts on the left with this negative consequence, which in our example is failure to meet the organization’s safety goal. Now, we start with one why: “Why was the safety goal impacted?” The safety goal was affected because the person suffered a cut to their left thumb, requiring five stitches.
1-Why Cause Map™
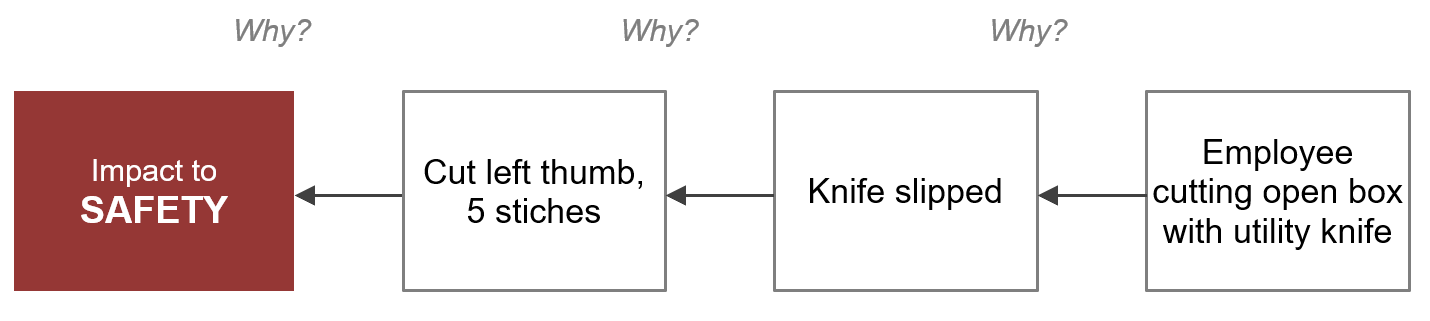
But why did the cut occur? The employee says the knife slipped. Why did the knife slip? The employee was opening a box with a utility knife. Answering these questions brings us to a 3-Why Cause Map diagram.
3-Why Cause Map™
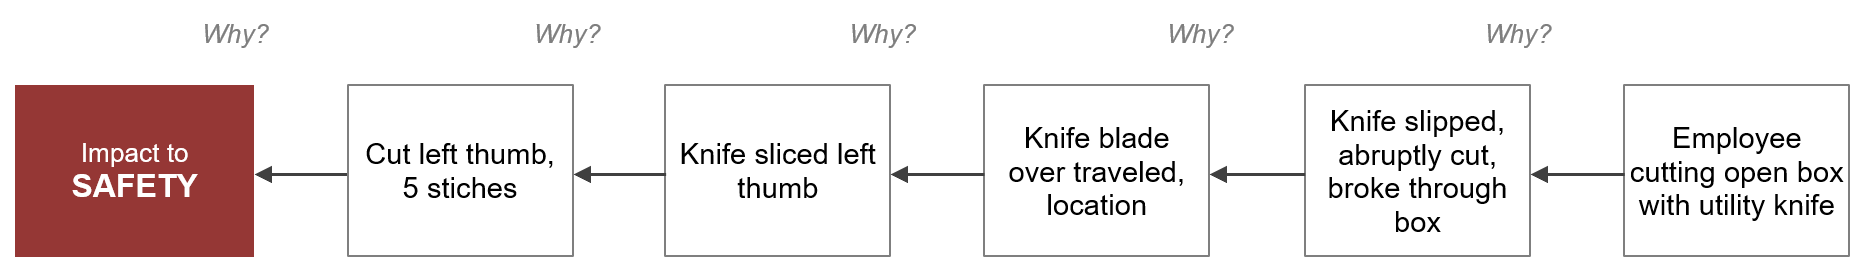
As an investigation progresses, the wording of the causes may need to get more specific. In the diagram above, knife slipped is accurate, but we need to ask a few more whys to explain exactly what happened. In the 5-Why below, we see that the knife slipped, abruptly cut, broke through box. This clarifies that the knife suddenly broke through the box, resulting in the knife over traveling beyond the planned cut point, resulting in slicing the left thumb.
5-Why Cause Map™
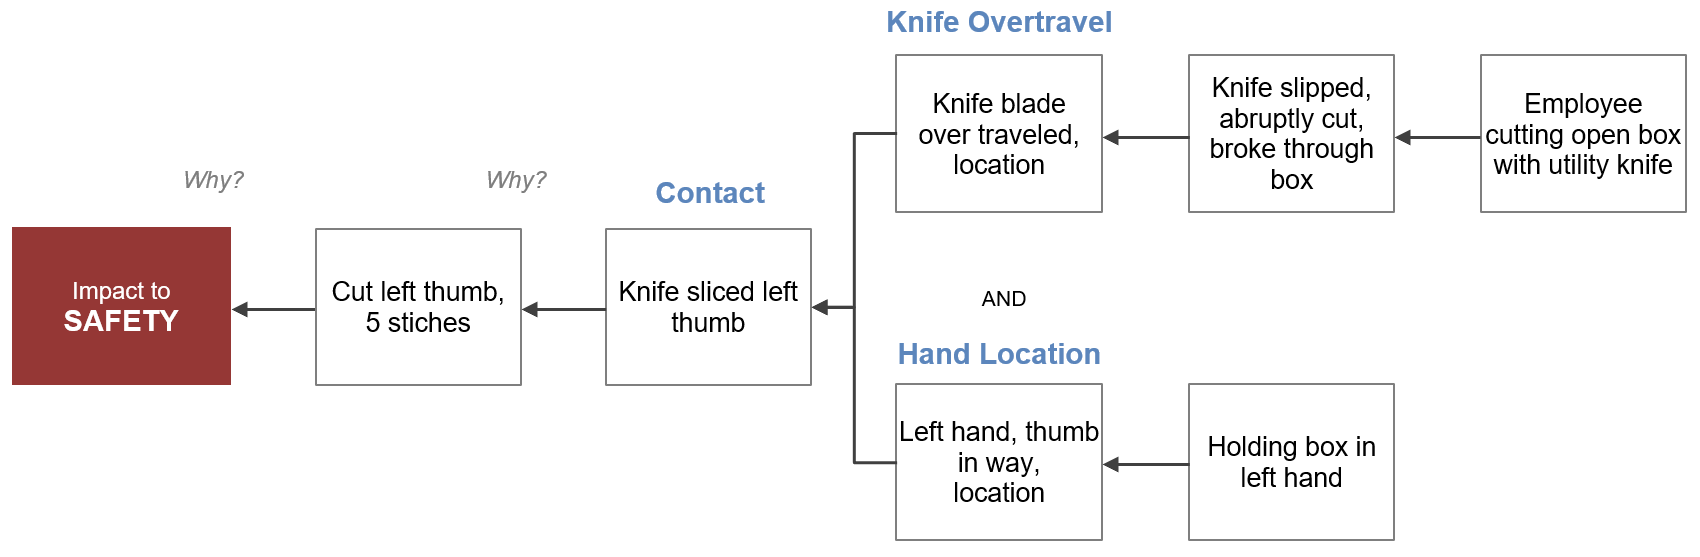
If we dig a bit deeper, we’ll uncover more causes. The 7-Why below shows a more thorough explanation than the 5-Why above.
7-Why Cause Map™
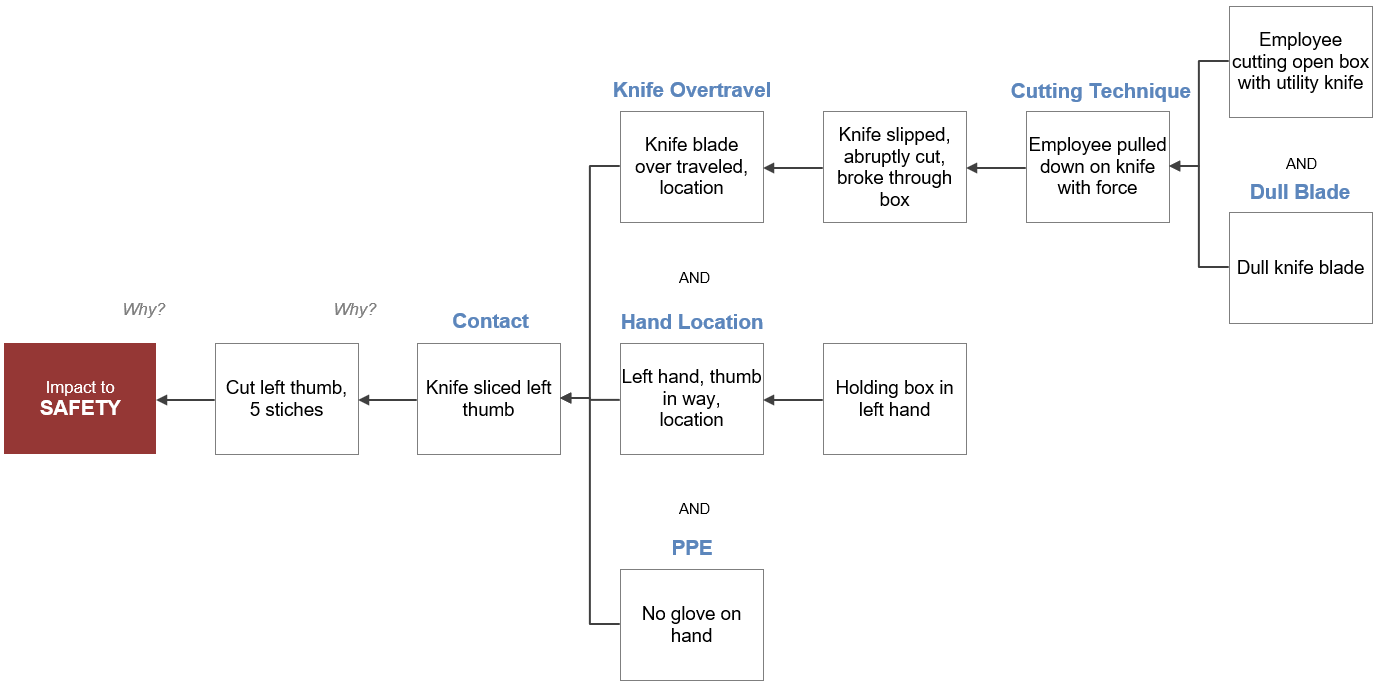
As we delve into the incident, we uncover more insights. For example, while examining the 7-Why, one person might highlight the importance of wearing gloves, while another might mention the dull blade contributed to the incident. We don’t need to argue—we can simply incorporate these facts into the map. The 10-Why below isn’t more “correct” than the 3-Why, 5-Why, and 7-Why Cause Map diagrams we built earlier, but it’s more complete.
10-Why Cause Map™
From Causes to Solutions
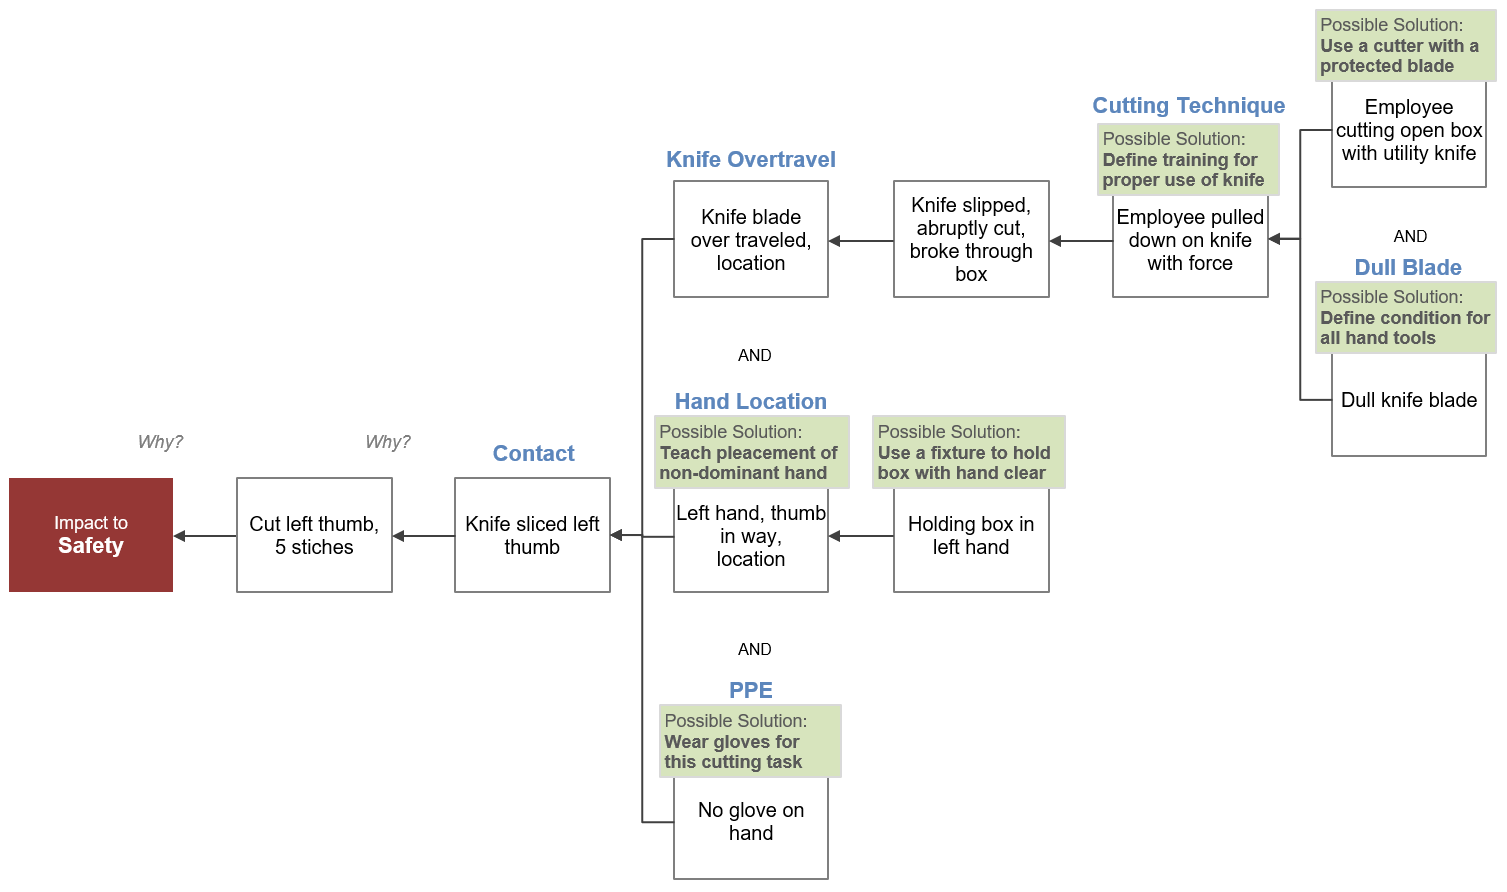
As we review the 10-Why Cause Map diagram, we can identify multiple solution options:
- To solve for the exposed blade of the utility knife, we could use a cutter that has a protected or recessed blade.
- To solve for hand location, we could use a fixture to hold boxes or teach employees how to correctly stabilize boxes with their non-dominant hand away from the path of the knife.
- To solve for unprotected hand, we could provide and mandate the use of cut-resistant gloves (PPE).
- To solve for cutting technique, we could provide training on the proper use of a utility knife.
- To solve for the dull blade, we could define the operating condition for all hand tools.
10-Why Cause Map™ with Solutions
Any cause can be modified to reduce incident risk. Changing two causes — that is, introducing two solutions — is called two layers of protection. The more layers of protection, the greater risk is reduced. The question at the heart of Cause Mapping root cause analysis is: “How solved do you want this problem?” Do you want the likelihood of avoiding the incident to be 90%, 99%, or 99.9%?
The purpose of the Cause Map diagram is to provide an accurate and thorough explanation of the incident to reveal the different ways the incident can be prevented. Those different solution options are then evaluated to determine the best combination of solutions to prevent it from occurring in the future.
Injury Prevention is in Your Hands. Start Now.
You don’t need to wait for a new incident to begin investigating hand injuries in your organization. Building a Cause Map diagram for a prior injury is a great way to build remediations that prevent future harm. It’s also an excellent opportunity to set the tone for how your organization approaches safety. To get started, check out one of our in-person or live online workshops.