
Losing weight is a common resolution people make at the start of a new year. Excess body fat can increase the risk of diabetes, heart disease and cancer. Even with all the information available and over $60 billion spent on diets annually, there’s still an incredible amount of confusion about how people gain and lose weight.
Follow along as we take a topic a lot of us can relate to – weight gain – and show how the cause-and-effect relationships layout in detail. A thorough understanding of a problem provides insight about what action can be taken. The Cause Mapping® root cause analysis approach works the same way for your health as it does for problems in your company. We’ll show the Cause Map™ diagrams for weight gain as 1-Why, 3-Why and 15-Why.
The 'Why' Question - Why Did I Gain Weight?
Some people will say their weight gain was because they ate too much. Others will say they didn’t move enough. In both instances, there’s a cause and effect relationship. There was weight gain (effect) because there wasn’t enough movement (cause) or because they ate too much (cause). As with any other problem, we’ll lay out the basic cause-and-effect relationships - also called a scientific approach. We’ll begin with the two, simple 1-Why Cause Map diagrams below. The analysis will expand into a 3-Why and a 15-Why as we dig into the details.
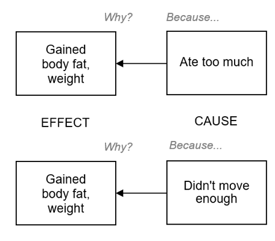
The Why question above, “Why did I gain weight?” has two different answers, yet both are accurate. Because people see problems differently, they also explain them differently. When discussing a problem, people within your company give different answers to questions. This is normal. Organizing all that information into a clear picture is what an effective root cause analysis does.
Even with different points of view, a scientific approach keeps the analysis objective by substantiating each piece of information with evidence. This is important because people have biases. Our four-minute video shows how a cause-and-effect analysis prevents miscommunications when discussing a problem as we build a 1-Why, 3-Why, 15-Why and 115-Why for the Titanic disaster.
It’s Net Calories
Those 1-Whys from above have been combined into a 3-Why with a parallel relationship below. Weight gain is caused by surplus energy in the body, which is the difference between the energy we take in and the energy we use. If you take in more energy than you use, the excess energy is stored as fat.
This is a basic 3-Why Cause Map diagram for gaining body fat.
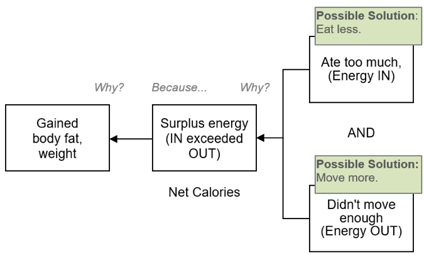
Notice two different solutions shown in green. To lose weight a person can take in fewer calories, they can increase their activity level, or they can do a combination of both. This 3-Why is accurate, but it can also be expanded. There’s a lot more to the systems within the body.
Our Cause Mapping method can start simple, but also allows us to dig into as much detail as needed to thoroughly understand an issue.
Some people argue that counting calories doesn’t work because the body processes macronutrients differently. But, counting calories does work - when they’re counted accurately. If people ignore the cause-and-effect relationships of the metabolic processes in the body, then calorie counting seems wrong. But it’s not. The first law of thermodynamics applies the same way in our digestive systems as it does in a power plant or refinery.
Fat is Stored Fuel
Any surplus energy in the body gets stored as fat and is available when needed. Think of filing a tank. If you put in more than you take out, the level will increase. Eventually, the tank will overfill when the volume exceeds the available capacity. Rather than overflowing, the human body increases in size to accommodate that surplus energy.
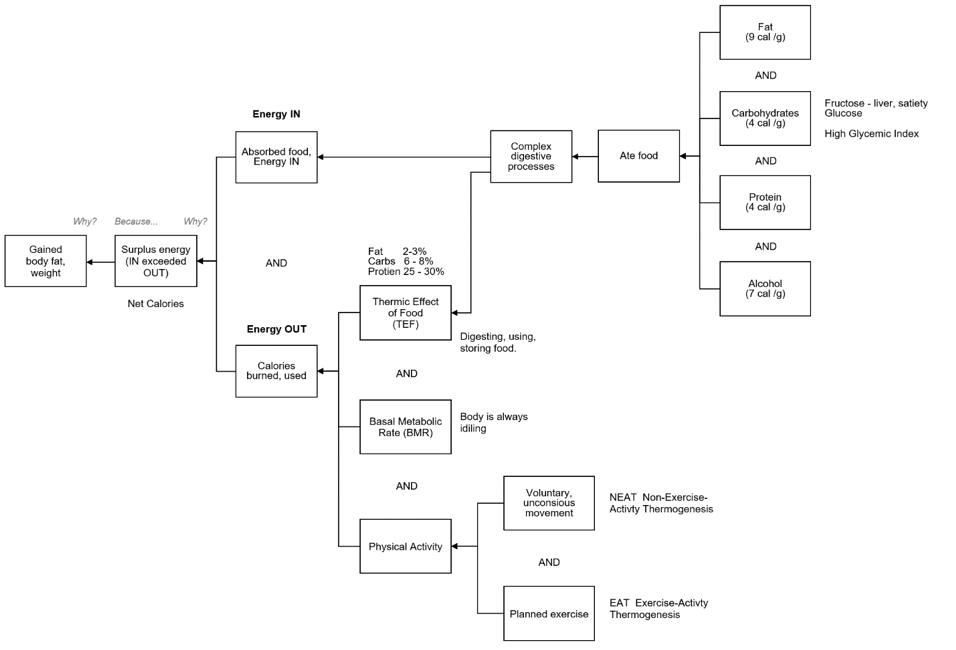
Below is a common equation for weight gain that matches up with the 3-Why and 15-Why Cause Map diagrams:
Surplus energy (body fat) = Energy IN (Food + Drink) - calories OUT (BMR + Activity)
Your Idling Engine - BMR
When you ask people how to burn calories, they typically say exercise. There are many benefits to regular exercise, but most of the energy we burn each day is from simply being alive.
The body is an engine that is always idling. Our heart is always pumping. Our lungs breathe 12 to 20 times per minute. Both of those actions require energy. Our brain, kidneys, liver and other organ functions also require energy. The calories we burn while we’re idling is called our Basal Metabolic Rate (BMR). It’s been measured in hundreds of thousands of people, so there are tables to determine your number based on gender, age, height and weight. Here is a link to a calculator to get an estimate of your BMR.
A 6-ft tall, 50-year-old male weighing 180-pound has a calculated BMR of 1718 calories per day (BodyBuilding.com), or about 1.1 calories per minute. He’ll burn 10 calories every 8 minutes by lying motionless on the floor.
A 40-year-old female who’s 5-ft 7-inches tall and weighs 130 pounds has a calculated BMR of 1617 calories per day. Meaning, she burns around 10 calories every 9 minutes by being alive.
Activity
Activity can include an exercise program, but any movement of our bodies burns energy: walking into the kitchen, standing up from a seated position, going to the mailbox, etc. All those movements burn calories because they require energy. The more weight you move the more energy is required. Raising your arm uses less energy than walking up a step because your body weighs more than your arm.
How the Fat Happened
Absorbing 10 calories of energy beyond what you burn is a net increase of only 10 calories per day. In one year, that’s 3,650 calories which is about one pound of fat.
That 10+ calories per day is about one ounce of regular cola or one small piece of chocolate. The gain is only 1 pound per year, but it’s 30 pounds in 30 years. If that 180-lb. male from earlier would have taken about 250 additional steps each day over that same 30-year period, he would not weigh 30 pounds more. If someone absorbed 20 calories of surplus energy each day in 30 years, they’d weigh 60 pounds more.
Losing excess body fat requires an energy deficit. A person may want to lose 10 pounds in a week. That weight loss requires a 35,000-calorie deficit (10-lbs x 3,500 cals/lb). Over seven days, that goal requires a net loss of 5,000 Calorie per day, which is not good, realistic or safe.
Here are the numbers for losing 10 pounds of body fat. A 100-Calorie deficit for 350 days will do it (35,000 cals ÷ 100 cals/day). Likewise, a 200 Calorie deficit per day would take half the time, or 175 days. If the person created a 500-calorie-a-day deficit it would take about 70 days to lose 10 pounds. A calorie deficit can happen a few different ways. The person can increase his or her activity level, reduce their calories or some combination of both.
The point is, there are many solutions, but you can’t get away from the basic cause-and-effect concept. If we don’t use the calories we take in, our body stores them.
15-Why Cause Map™ Diagram for Weight Gain
This is a more detailed Cause Map diagram for weight loss. It shows a causal path where the Thermic Effect of food is part of the calories that are burned for digestion (Energy Out). It shows two effects for that one cause (click the image to enlarge).
The good news is subtle changes, such as taking a walk each day, can make a big difference. People shouldn’t hope to lose weight. They should manage the cause-and-effect relationships to produce the results they want.
Apply This to Your Organization
The more you understand a problem the more options you have to solve it. The problems in your company break out the same way. Root cause analysis is a systematic approach to understanding something thoroughly so that effective action can be taken.
If you already have experience on this topic, maybe you’ve lost weight on your own program, we’d like to hear what you did. If you know a nutrition expert, please forward this to them. We want the information to be accurate, so feedback would be appreciated. You can contact me here or comment on this blog.
If you thought this was interesting, but want to see us Cause Mapping in action, check out the recording of our webinar: Can Root Cause Analysis Help with your Weight Loss Goals? In this webinar, Mark shows how we built the Cause Map diagrams for weight gain.


