On the second Sunday in March, most of the U.S. changes their clocks to daylight saving time (DST). By moving the clock forward an hour, Americans take advantage of an extra hour of sunshine in the afternoon until it ends on the first Sunday in November and the clocks go back again. Although the biannual clock shift has proponents and critics, today, we’re focusing on its impact on workplace injuries.
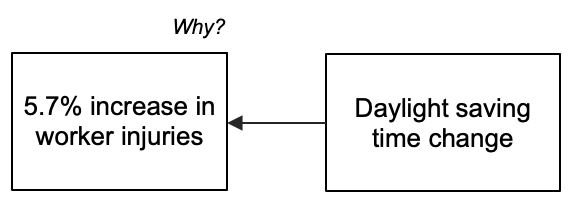
This time transition has significant ramifications—particularly in the spring when clocks move forward, resulting in most of us “losing” an hour of sleep. According to an article in the Journal of Applied Psychology (2009), losing 40 minutes or more of sleep at daylight saving time resulted in a 5.7 percent increase in injuries and a 67.6 percent loss of work days due to injuries. That’s based on data collected from 1983-2006.
But before we dig into the research and why these injuries occur, let’s better understand the context of daylight saving time and its history.
When Satire Becomes Mandate
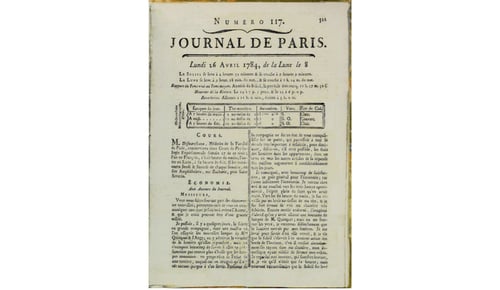
 Although he wasn’t the first person on record to propose the idea, Benjamin Franklin suggested the time-changing habit in satire when he was stationed in France as a diplomat. It’s written that Franklin proposed changing wake habits to keep up with the changing duration of sunlight. The tongue-in-cheek Journal de Paris article proposed a tax be paid for every window with shutters, candle shops be guarded with a purchase limit, all coaches be stopped after sunset (except for doctors, surgeons and midwives), and, he even went so far as to say church bells should ring and cannons be shot upon sunrise each day.
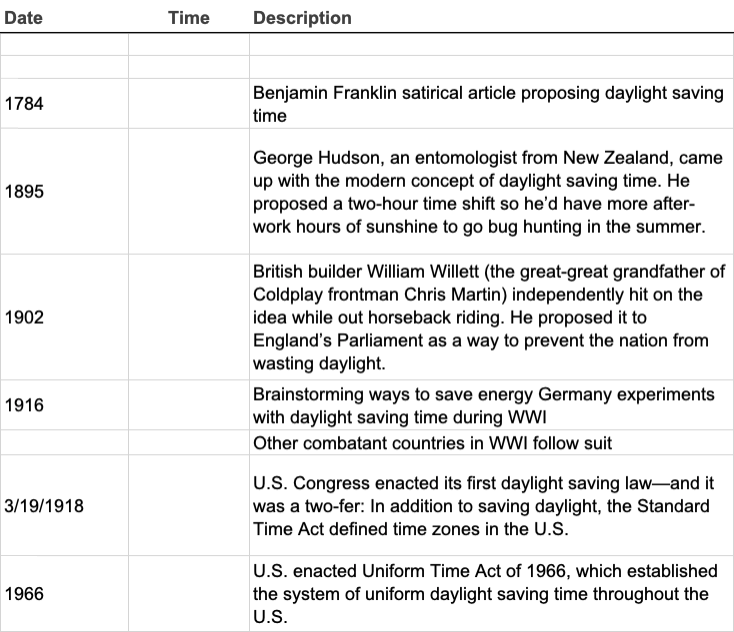
A New Zealand entomologist would suggest what would become modern DST in the late 1800s. Later, after its initial proposal by William Willett, the British would go back and forth on considering enacting a clock change until World War I when the Germans first enacted daylight saving time to help conserve coal. Britain and most of its allies followed suit. The U.S. stopped DST shortly after and used it again during World War II, but it wasn’t regulated until it became law in 1966. At that time, it was enacted due to the additional hour of sunlight as well as the energy savings. (The energy savings are less pronounced nowadays—saving around 0.5 percent during DST in a 2008 study—about 1.3 billion kilowatt hours.) To better organize this historical information, I’ve placed the background of the practice into a timeline below.

Increased Risk of Workplace Injuries with Clock Shifts
According to recent research, on Mondays directly following the switch to daylight saving time, workers sleep on average 40 minutes less than on other days. On Mondays directly following the switch back to standard time in the fall — in which clocks “fall back” and an hour is gained—there are no significant differences in sleep, injury quantity or injury severity. The journal article goes on to conclude with a stark warning, “We therefore conclude that schedule changes, such as those involved in switches to and from Daylight Saving Time, place employees in clear and present danger. Such changes put employees in a position in which they are more likely to be injured—these injuries being especially severe, and perhaps resulting in death.” In other research, the transition has been linked to higher heart attack risk, more car accident fatalities and other negative outcomes.
We can begin to better understand the cause-and-effect relationships within daylight saving time-related workplace injuries using the Cause Mapping® method of root cause analysis. By breaking it out and seeing the causes that contribute to the increase in injuries, we open up opportunities for additional, creative solution options. So here’s the challenge: build your own Cause Map diagram digging into the impact of DST on workplace injuries.
To begin, a 1-Why Cause Map diagram for this incident might look like this:

The 1-Why is accurate, but it's simple. What additional information about why workplace injuries occur following daylight saving time would need to be included to thoroughly understand the issue? To reveal the detail, you’ll continue to ask Why questions and expand your Map.
Remember, an incident happened one way and required all of its causes. Your Cause Map diagram can begin simply with a 5-Why and expand as much or as little as it needs to for you to thoroughly understand the issue and find effective solutions. There is no set number of causes for you to uncover. A 5-Why and a 20-Why can both be accurate and in agreement—the 5-Why is just a less detailed, partial explanation. The more cause-and-effect relationships you uncover, the more detailed your analysis is.
Using the information provided above, you can build your Cause Map diagram with sticky notes and submit the photo, draw the Map and submit the photo, or you can use our free Cause Mapping Investigation Template in Microsoft Excel and submit the Excel file. Choose the medium that works best for you. Click the button below to submit yours! For more information on root cause analysis and how to build your Cause Map diagram, visit the ThinkReliability YouTube channel here.
In about two weeks, when we prepare to spring forward our clocks, consider going to bed an hour earlier and asking your coworkers to consider doing the same, or find additional solution options on your own Cause Map diagram. Want to learn more about the method?


