We are in unprecedented territory dealing with the COVID-19 outbreak. There have been many avenues of response to this crisis, but one of the “head-scratchers” is the hoarding of toilet paper. This virus is a respiratory disease, yet toilet paper, which can in no way help with the disease, is unable to be found on store shelves.
While we are continuing to learn about the virus itself and the global need to get the pandemic under control, a look at the causes behind the hoarding can give us some sense of understanding of the response. To do that, we can start with a Cause Map™ diagram and analyze the cause-and-effect relationships that occurred.
The analysis begins by completing a brief overview of the issue, what we call a problem outline. As this is a global issue, I focused on the impact to all of us as the customer. In addition, since this is a commodity item, I also looked at the production schedule of toilet paper.
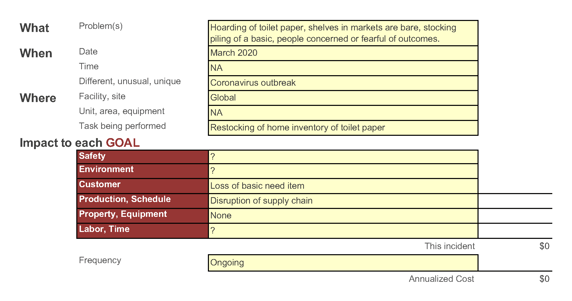
While this is an extraordinary issue, we can still do an analysis of one component to allow us to gain a better understanding of what is happening. With an issue of this magnitude, we often include a timeline. But the overall outbreak analysis has been well documented worldwide, so we are going to focus on the problem outline and Cause Map diagram.
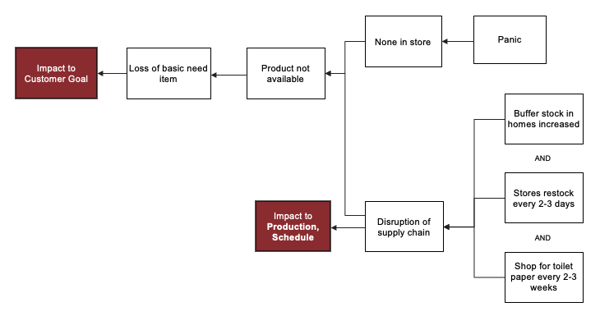
To start the analysis, we will use a basic 5-Why, starting with the impact to the customer goal we put in the problem outline above. This is done by asking five Why questions in series, and it gives us one view of the issue. So if we ask, why was there a loss of a basic need item, the answer on this 5-Why is the product was not available. Why? There were none in the store... and so on. You can see the effect is on the left and the cause is on the right. This basic, linear map created with a few Why questions lays a framework for a more detailed analysis. Remember, this is just one way to start. There isn't one root cause or one correct 5-Why. A 5-Why shows one point-of-view, so although each 5-Why can be different, they should be accurate and reflect what happened.

Once we have the 5-Why in place we can proceed with adding the impact to the production goal. The impact for this goal has several parallel causes:
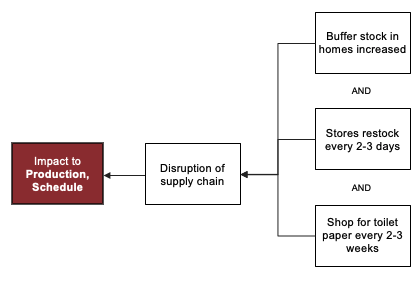
When we have this piece of the analysis in place, we can begin to see how the two goals fit together into one Map. From here, we continue to expand a more detailed look at the issue and its causes.
Areas of the Cause Map™ Diagram
As we continue adding detail to the Cause Map diagram by asking more Why questions, three areas begin to emerge. Section one shows how people have a sort of knee-jerk reaction to the lack of control and the second section shows preparation for a worst case scenario--both showing human nature during crises. It is human nature to be concerned when crisis situations are in motion, and even more so when we don’t understand the issue (that is, when it has so many unknowns). In these sections, the solutions center around improved communication tactics and developing trust that the situation is being addressed.
The third section looks at the supply side of the situation. What is the supply chain prepared to handle? Is it stable? Prior to the pandemic, the supply and use of toilet paper was well understood, leading to consistent purchasing patterns by the stores. When the pandemic hit, the supply chain was turned on its head and shortages occurred. When customers saw the empty shelves, it encouraged more hoarding. For this section, the solutions center on bringing a sense of order and stability back to the supply situation. One solution, and one implemented fairly quickly, is to limit the amount of material people can purchase, to give the supply chain time to catch up. As we saw, many stores implemented purchase limits.
Finally, we can show the entire Cause Map diagram to show the larger picture of what is occurring. Click on the intermediate Map below to download the PDF.
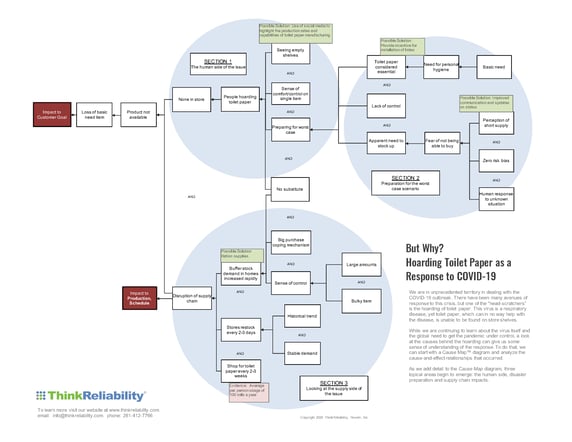
We hope that by seeing an overall picture, you get an idea how a Cause Map diagram can give you an idea about what you can do to help ease the situation. By using the visual aspect, we can present a complex issue in easy-to-understand, visual manner.