When analyzing the causes for a problem, it is very common to find possible solutions that would significantly reduce the risk of a problem but cannot be implemented because they are outside of the scope of control of the organization. This happens in all industries, but in this case, I am providing a timely healthcare example. According to the CDC, there is a higher risk of harm for those who contract COVID-19 when they also have underlying conditions and comorbidities. A comorbidity is the simultaneous presence of two or more diseases or medical conditions in a patient.
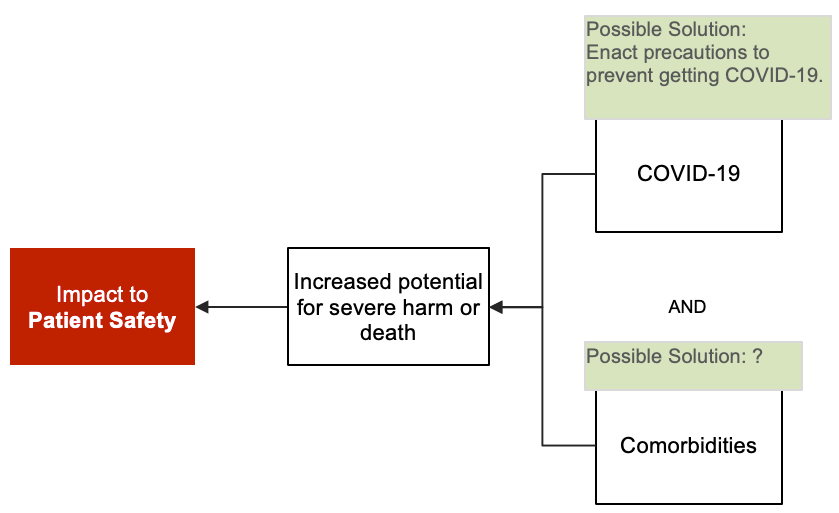
Here, I’ll use Cause Mapping® root cause analysis, a visual cause-and-effect analysis, to break down this issue and show how digging into a problem at greater detail provides greater opportunities to reduce risk. A Cause Map™ diagram begins with the impact to the goals, which is the impact to safety in this situation. From here, we begin with the negative effect, “Increased potential for severe harm or death” and ask Why questions moving to the right.

The first iteration of this Cause Map™ diagram shows that the potential for serious harm from COVID is greatly increased when a person has comorbidities. Both causes are required in this specific scenario. There are solutions to reduce the risk of contracting COVID, but these solutions may not reduce the risk to an acceptable level due to the contagious nature of the virus. A more effective solution would be to eliminate the comorbidities, but these are pre-existing conditions that are the result of lifestyle or genetics. A healthcare provider has little control over implementing solutions in this area.
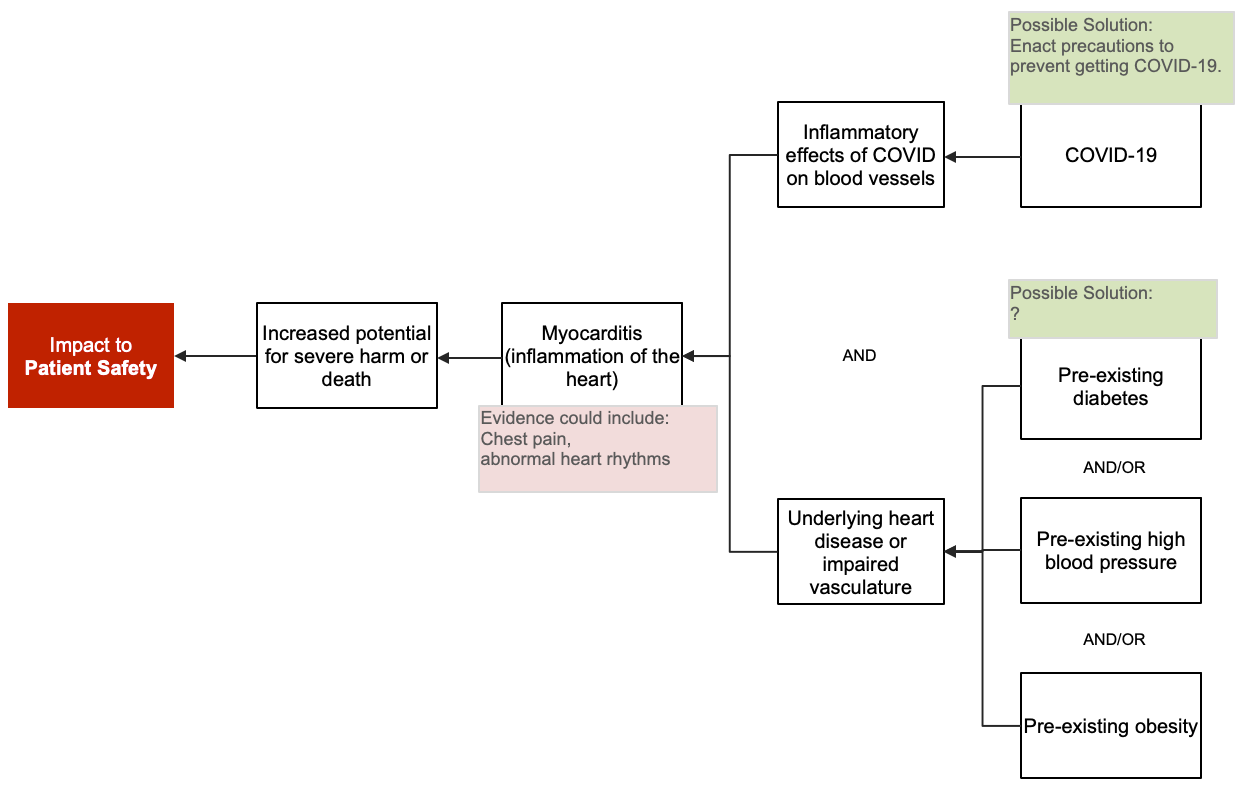
Our solution options are limited at this level of detail. For this second iteration, the Cause Map diagram “zooms in” to the detail of how a particular kind of comorbidity, underlying heart disease, may interact with COVID to increase the potential for severe harm. This additional detail shows that pre-existing diabetes is one specific example of a comorbidity. A better understanding of specifically how diabetes increases the risk associated with COVID may reveal additional solutions.

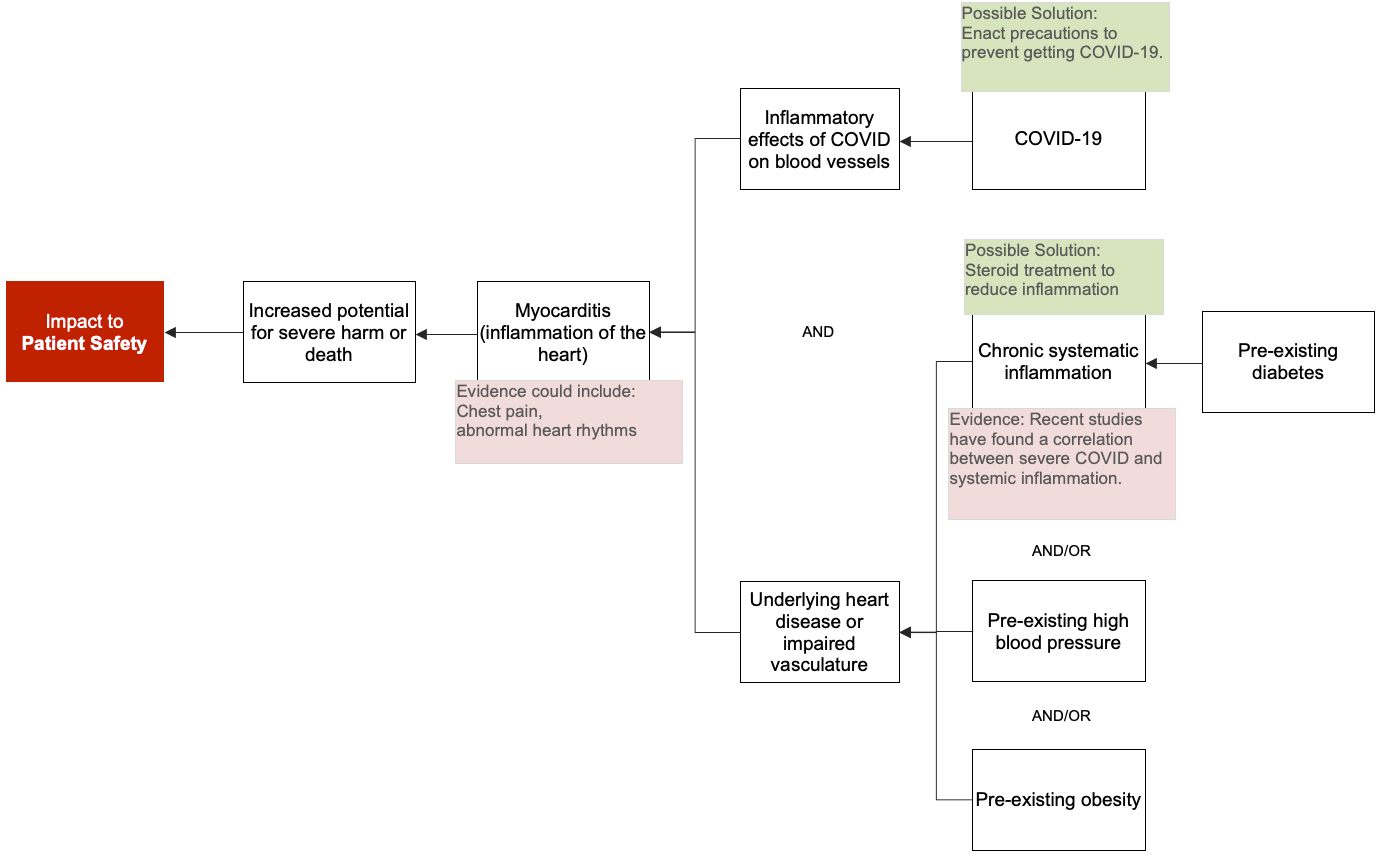
The third Cause Map diagram provides somewhat more detail that is specific to the issue of diabetes. If chronic inflammation is how diabetes increases the risk associated with COVID, then people with diabetes and COVID may benefit from specific treatments that address that mechanism.

As you see here, this Map is accurate, but could be expanded to include even more additional detail. This is an example of how an understanding of the detailed causes can still lead to more effective solutions, even if some of the causes initially seem to be outside the scope of an organization’s control. This principle applies to all kinds of problems in all industries.
For additional information on Cause Mapping root cause analysis, consider attending one of our upcoming training sessions.


