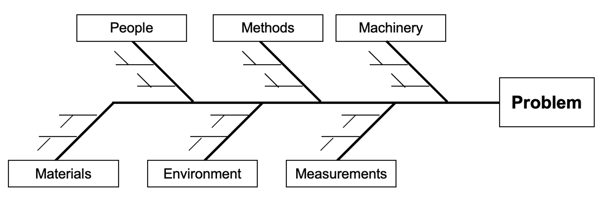
The Ishikawa Fishbone Diagram is a globally recognized cause-and-effect based problem-solving tool. It’s one of the seven basic quality tools and a standard in 6-sigma methods. Developed by Kaoru Ishikawa in Japan, it provides a visual diagram that shows the causes of a problem by category. It gets its name from its shape. The problem is the head of the fish, which is on the right. There is a horizontal line representing the backbone, and there are ribs that branch off into different categories to group the causes.
What our clients find valuable about our Cause Mapping® method wouldn’t have been possible without the work Ishikawa did. Our method builds upon the pioneering work Ishikawa did. Even the direction of the Cause Map™ diagram – Why questions reading left to right - is based on the fishbone diagram. The reason the problem is on the right side of a fishbone is because Japanese reads right to left. Since we speak English, the Cause Map diagram reads in the direction of Why questions. Just like Ishikawa did.
After working a lot of issues using the fishbone diagram in the 1990s, it began to seem strange to start with a predefined shape when the incident already had its own structure. This is not intended to be a negative critique of the fishbone, but by testing each element of the fishbone, I learned what was beneficial about the approach and what could be improved.
Capture the Complete Problem Definition
The first step of the fishbone is to agree on the problem. While this seems like the obvious way to start, people don’t typically see problems the same way. The question, “What’s the problem?” yields different answers.
One incident can impact production, create a customer service issue and result in damage to equipment. This “problem” has three different adverse outcomes that are part of the overall issue. Each one connects to the others, but they don’t necessarily have the same causes. The premise of the fishbone is there is one single effect for a given problem—written in the box with all the causes related to that one problem. This does not reflect the nature of real problems. A complete problem would need to show the three different impacts on the same diagram.
Focus on Evidence, Instead of Brainstorming Causes
The steps of the fishbone also encourage you to brainstorm possible causes. But brainstorming should be primarily for identifying possible solutions. Your investigation will identify possible causes, but only where evidence is missing. Possible causes are placeholders for collecting more information. By asking for possible causes, it gives people license to speculate unnecessarily. It’s normal that you don't know those causes at the beginning, which is why you collect evidence. When analyzing a problem, rather than brainstorming more and more causes, spend that time gathering specific evidence to support or disprove the possible causes as they come up.
Identify Cause-and-Effect Relationships, Rather Than Generic Grouping
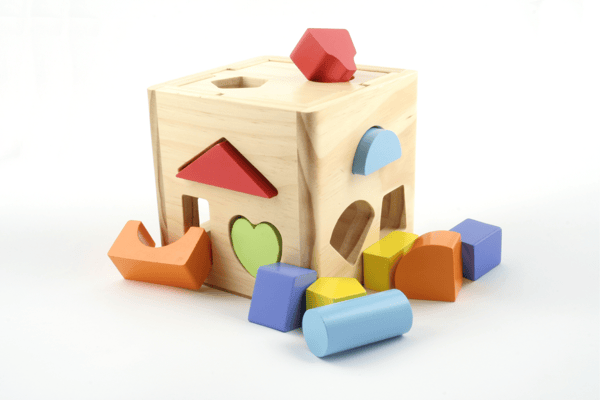
People like categorization. It matches what we call “right-answer thinking.” People like to be right, and they want to put things in the right category (just like with the shape sorters when we were little). Too often, people expect the technique to provide the structure, which makes a categorization scheme seem appealing. But the incident already happened and, therefore, it has a structure that is explained by revealing the cause-and-effect relationships. A problem needs to be analyzed, which means broken into parts, not categorized into groups. Making the incident fit into a predefined shape is contrived, not scientific. However, many organizations believe the purpose of an investigation is to put the cause or the entire incident into the right category.
Tie Problems Back to Work Process
At ThinkReliability, we teach companies and individuals how to explain a problem, and then, connect the solutions to specific improvements in their work processes. Your incidents are breakdowns in work processes, and the investigations should identify specific solutions within those work processes. You have to show these individual cause-and-effect relationships to see what the system looks like and which work processes need to be addressed.
Access Better Solutions by Providing a Thorough Analysis
An incident consists of all its causes. For example, people may say there are three causes of fire. The fire triangle happens because of heat, fuel and oxygen, but if you zoom into the details, you’ll find there’s a chemical reaction occurring. So, at another level, fire has four causes. And there are additional Why questions down each causal path. So yes, fire has three causes. It has four causes. And it can have 10 and 15 causes depending on how much detail you choose to reveal. The question is, how well do you need to understand the problem? A recurring issue is evidence that the problem wasn’t understood well enough.
Experiment With Our Cause Mapping® Method
Consider some of these subtle changes to the fishbone that can improve the way you analyze and solve problems. Try Mapping the cause-and-effect relationships of your problem rather than sorting individual causes. Learn more with one of our upcoming free webinars, or send us one of your fishbone diagrams, and we’ll break it out using the Cause Mapping method.