Did you know there was series of major security breaches in 2020—affecting the U.S. Department of Homeland Security, National Nuclear Security Administration, European Parliament, NATO and about 200 additional worldwide organizations? With the already headline-making year, many people didn’t hear about this massive incident that went undetected for months. So for those of you catching up, here’s what happened and why.
The Cyberattack
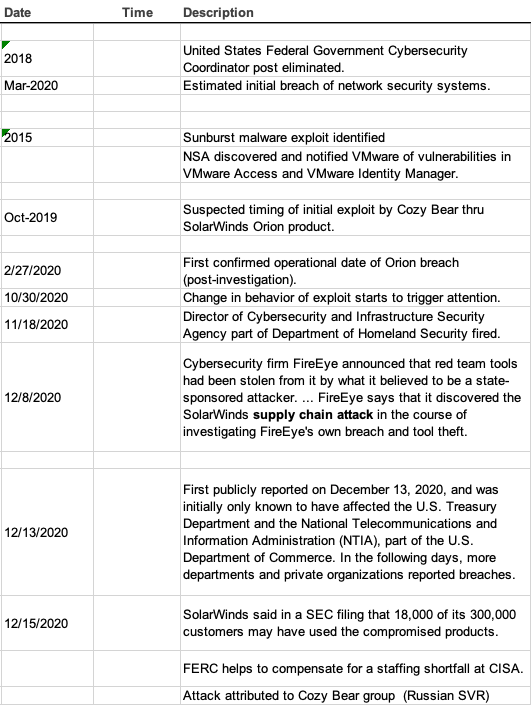
Starting no later than March 2020, the massive cyberattack began—and went undetected until November or December. (It was publicly reported Dec. 13, 2020.) The supply chain attacks occurred on cybersecurity software, including Microsoft cloud services, VMware and SolarWinds Orion software. SolarWinds, like many software companies, pushed out updates regularly, and the attackers were able to hack into these updates, so end users unwittingly put the malware on their own computers. (According to the company, up to 18,000 Orion customers could have been affected by the attack.) From there, the hackers could put even more malware into the information systems. U.S. intelligence agencies and cybersecurity experts believe the Russian, SVR-backed hackers referred to as Cozy Bear or APT29, were behind the attack. Experts still don’t know the extent of the data breach. I built a timeline of the incident for reference.
Instead of hacking the institutions themselves, the hackers were able to attack the services in place that were supposed to keep data and information secure. It leads me to ask, who watches the watchers? What can we learn from a data breach called “tantamount to a declaration of war” by one U.S. Senator?
Analyzing the Hack
Here, we turn to the Cause Mapping® method of root cause analysis to better understand why this happened and what can be done to prevent recurrence. We can begin building the Cause Map™ diagram, a visual of an incident’s cause-and-effect relationships. We begin with the impact to the goals on the left and build to the right as we ask Why questions. So, if we begin by looking at the impact to the safety goal, a 2-Why might look like this:
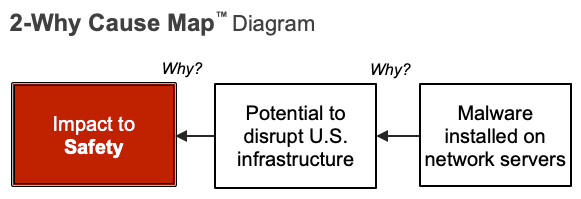
Why was there an impact to safety? Because there was the potential for access of confidential and/or classified information. Why? Because malware was able to access client data. Here, we begin to lay out the cause-and-effect relationships within the incident. From here, we can continue to ask Why questions and add detail to better understand what happened and why.
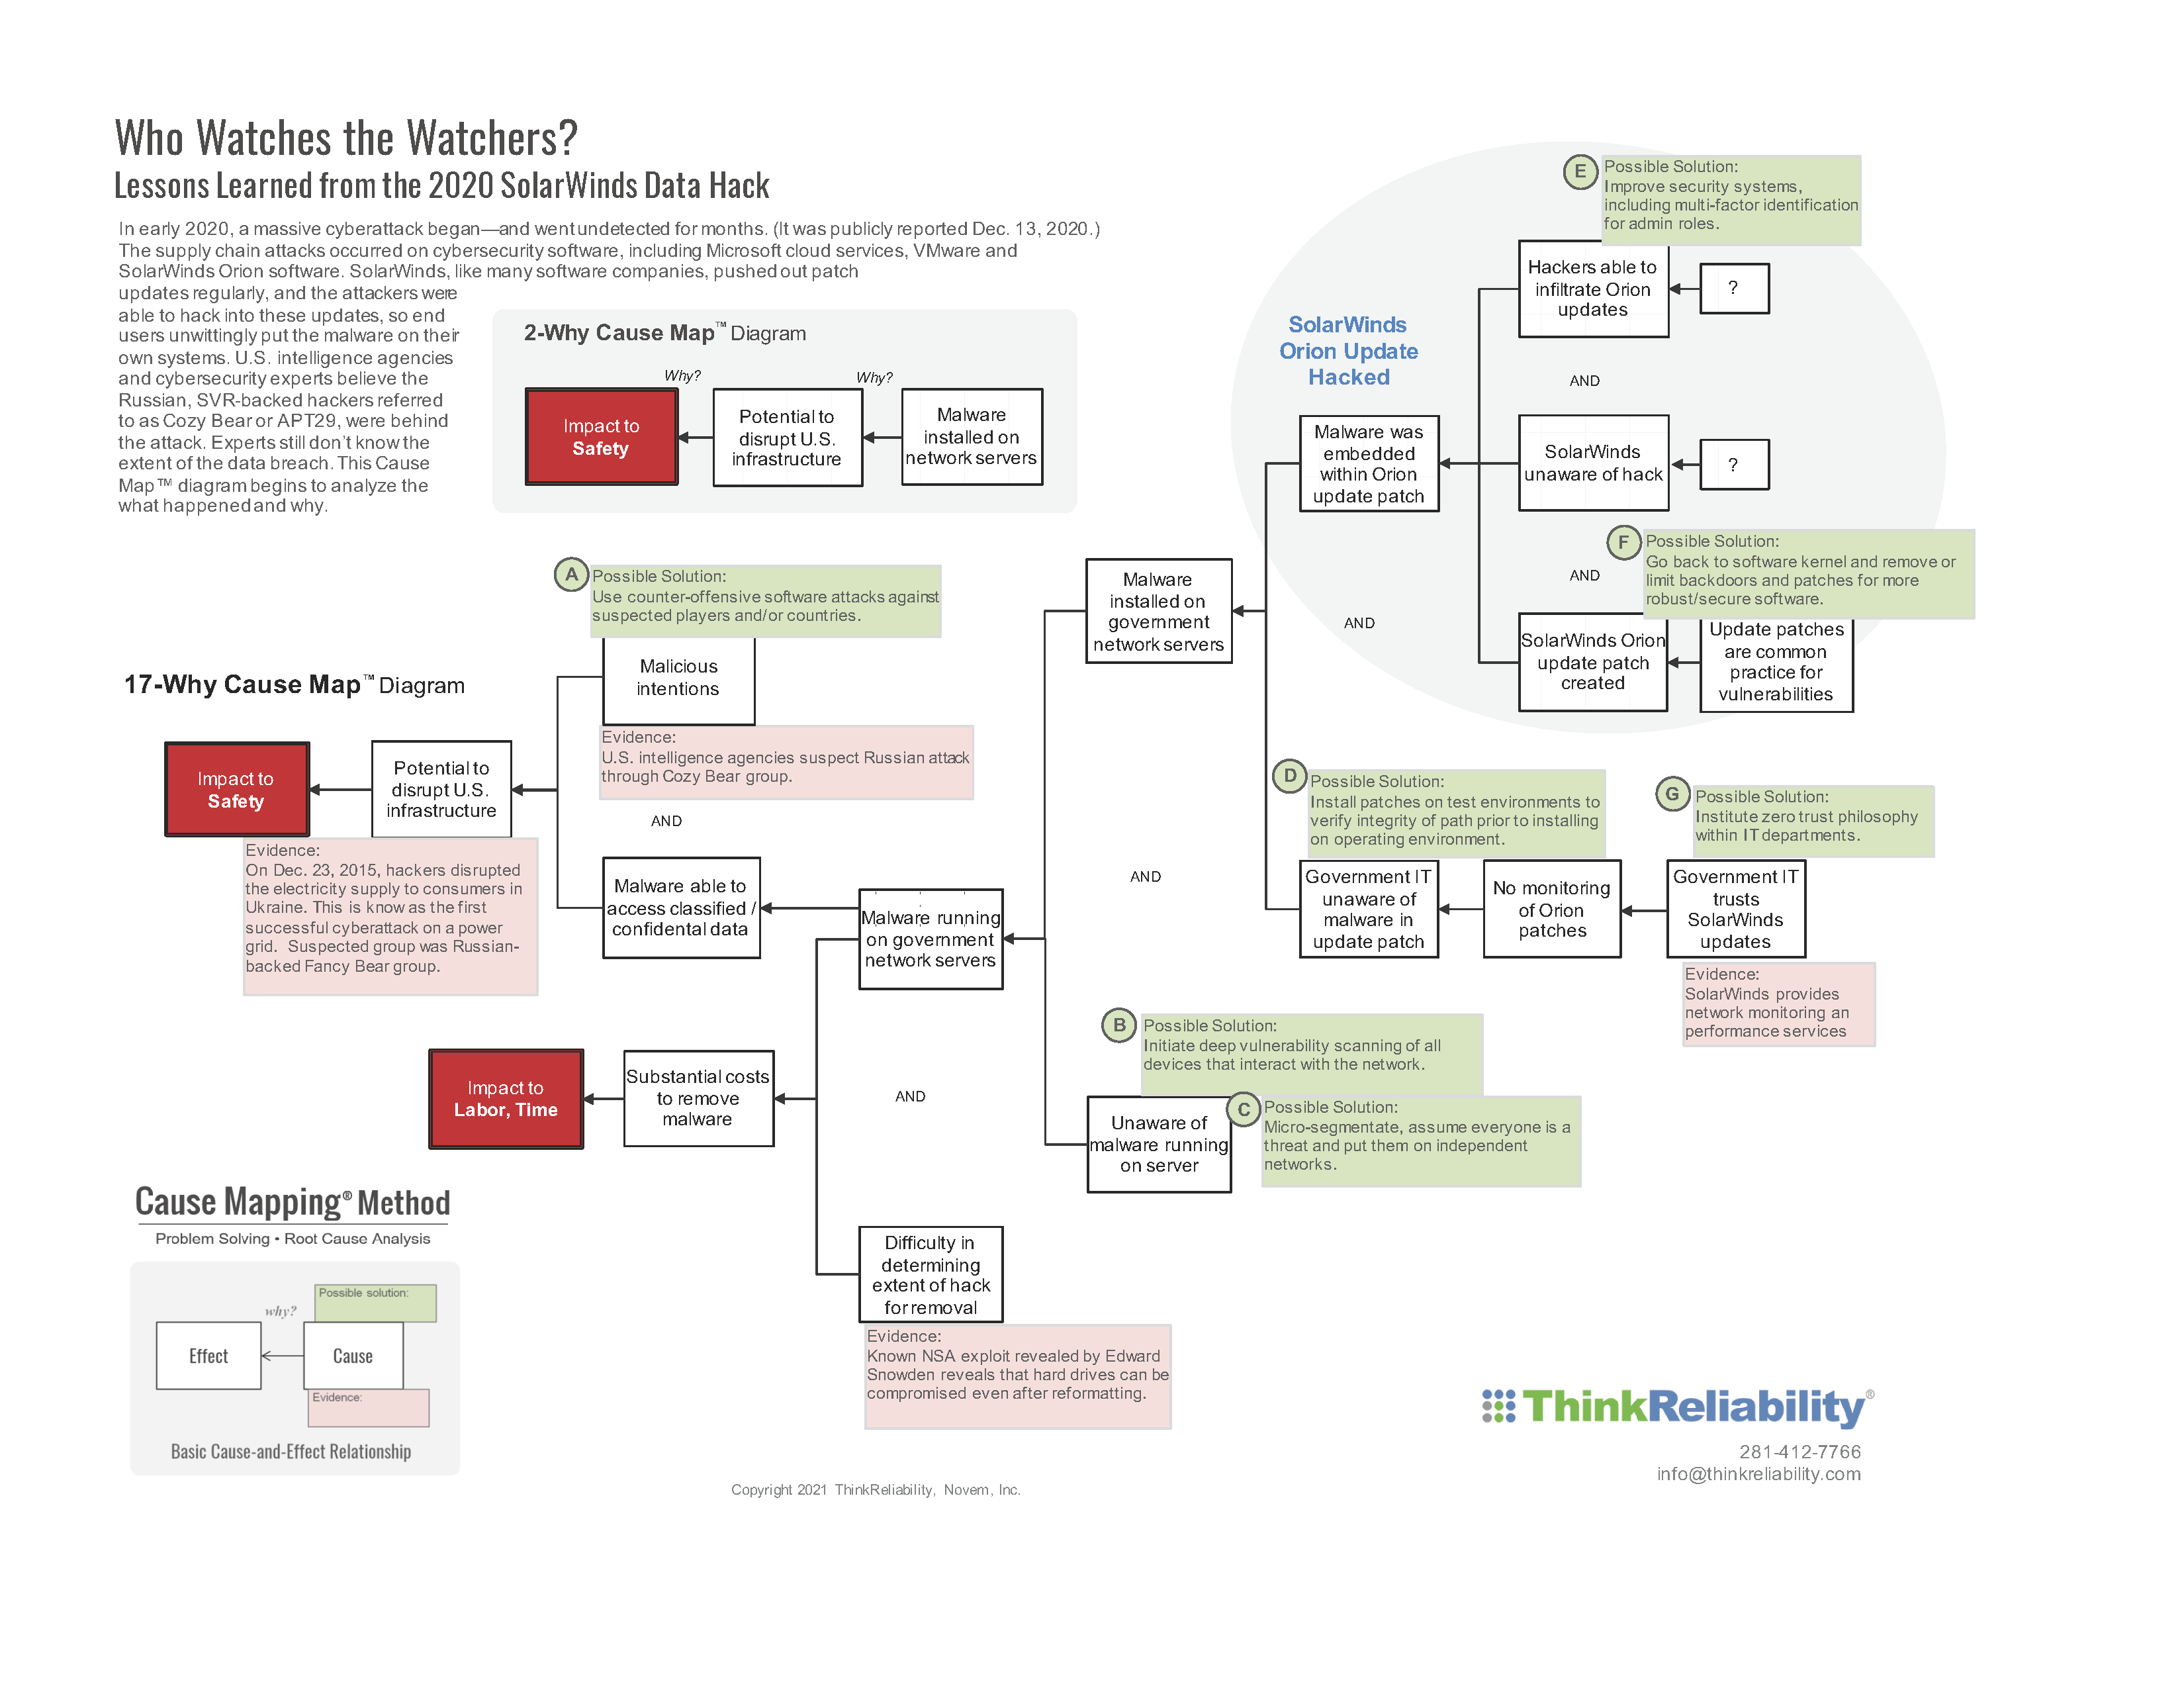
If we stopped the analysis at the 2-Why Cause Map diagram, though, we’re limited in solution options. A possible solution to control one of the causes might be, “don’t let malware access client data.” It’s not very specific or particularly helpful. But as we uncover more evidence and the Map expands as detail is added, we begin to see more solution options to control causes along multiple causal paths. Click on the image below to download the PDF with the 17-Why Cause Map diagram.
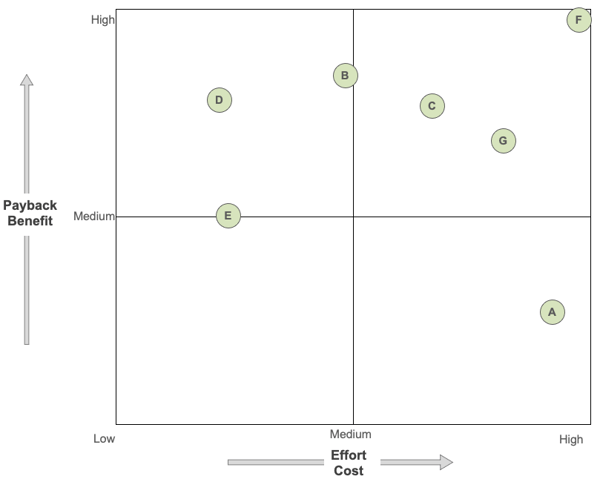
 If you need help choosing solutions, you can utilize the solution matrix within the Cause Mapping Investigation Template in Microsoft Excel to evaluate each option in relation to each other. This is a PICK chart that allows you a visual way to consider the payback/benefit of each solution (Y axis) versus the estimated effort/cost to enact it (X axis). The cost of a solution is often more quantitative in nature—taking resource expenditures like money, time, labor, etc. into account, whereas the benefit is often more subjective. That is where subject matter expertise can be vital for evaluating the best solutions. Keep in mind, some solutions may be more beneficial working in tandem (providing multiple layers of protection), rather than when enacted as a sole solution. Below, I’ve included a solution matrix that could accompany the above Cause Map diagram and its solution options, for reference.
Reducing Risk with Layers of Protection
By adding additional detail and expanding the 3-Why into an 18-Why, the solution options expand. On the 18-Why above, we now have five possible solutions on the Cause Map diagram. Implementing just one of the solutions would provide a reduction in risk, but if you implemented multiple you would have a cumulative reduction in risk. This is called layers of protection. Each solution on a causal path offers another added layer of protection to prevent a similar type of cyberattack. We add detail and expand our Cause Map diagrams in an effort to find more opportunities to control causes and lower the risk of incident recurrence.
For more information about the Cause Mapping method and how to use it for your incident investigations, whether in IT or another industry, check out one of our upcoming free webinars or Cause Mapping Root Cause Analysis Online Workshops.