
As Super Bowl LIV approaches, I can’t help but to think about Super Bowl XLVII in 2013. Beyonce had just lit up the stadium with her halftime performance and the Baltimore Ravens were leading the San Francisco 49ers 28-6 in the third quarter. Suddenly, the power went out, delaying the game more than half an hour. Once power was restored, the 49ers scored 17 unanswered points, making it a 28-23 game. The game continued back and forth until the Ravens came out victorious, 34-31.
As a fan, I sat in amazement when the power outage began. What chaos. I can’t imagine being a player or a coach on the field and seeing the momentum suddenly shift after the delay. Or being one of the companies that paid millions of dollars for a commercial that may not reach the expected number of viewers if they lose interest as the delay (and unknowns) continued. Or, as a ticket holder, I may be a bit frustrated with the experience.
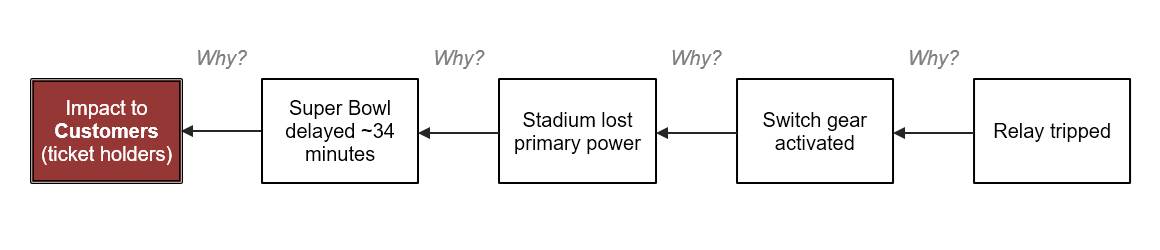
A Cause Map™ diagram, a visual format for performing a root cause analysis, may be used to capture all of these problems from various perspectives and to help further understand why the power outage occurred. A Cause Map diagram is built by starting at an impacted goal and asking Why questions. The answer to each Why question is documented in a cause box, until ultimately, it builds to create a visual representation of what happened and why. (You can see our original blog on the subject here.)
For the sake of this example, let’s start with just the customer experience at the stadium. The goal was to provide customers with an uninterrupted experience viewing the Super Bowl. The fact that their experience was interrupted by a 30-minute power outage is an impact to that goal. By asking Why questions, we begin to learn that the power outage happened when the switch gear was activated after a relay tripped. The switch gear operated as designed (isolating the equipment to protect it from the fault). It was later learned that the relay tripped when the electrical load exceeded the trip setting. These cause-and-effect relationships are shown on a basic 5-Why Cause Map diagram below.
By asking additional questions, the plot thickens and the Map expands. The intent of further developing the investigation isn’t to make it more complicated, but to reveal potential solutions or additional opportunities that may exist.
It was realized that the electrical feeders had been identified as having “some decay and a chance of failure” prior to the event. The stadium upgraded portions of the electrical system the December before the infamous blackout, and the upgrades included installation of the tripped relay that led to the power outage.
By understanding these aspects, it provides additional opportunities for solutions. Now, instead of just looking at “replacing relay” or “update trip setting of the relay,” we can discuss how the concerns of the potential failure were not effectively addressed. We can also understand opportunities within selection, installation and the testing/validation of electrical components to help ensure the proper equipment is installed for the intended application.
Tune into my webinar on Jan. 31, 2020, to see how I expand the Cause Map diagram to capture additional perspectives of the problem (the two teams, companies that purchased advertising, etc.) and demonstrate how a Cause Map diagram is built and serves as a valuable investigation tool.


