Lately, whether you’re shopping in-store or online, watching the news or talking to business owners, there’s a buzz about empty spaces on store shelves and the inability to fill product orders. One implication of the COVID-19 global pandemic is the impact on general products we rely on as consumers.
As the holiday season approaches and holiday-related consumer spending increases, this impact will become more and more apparent. We decided to dig a little deeper to see if we could Map out specific causes of the product shortages and how those might impact your holiday shopping this year. Many reports recently have been focused on issues with the global supply chain, specifically the logjam occurring at our nation’s ports. Through our research, we also identified another item receiving less attention, and it is our increased demand for consumer goods.
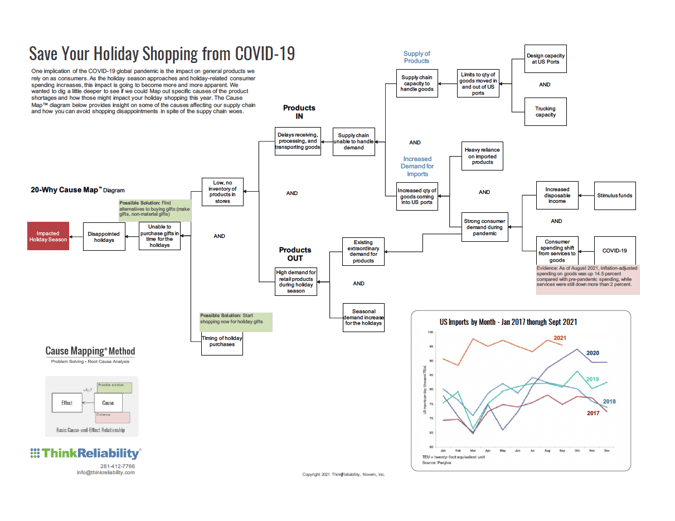
To help provide a clear explanation, I’ve built a Cause Map™ diagram to reveal the system of causes. For example, the causal relationship below represents two fundamental causes that affect the US supply chain.
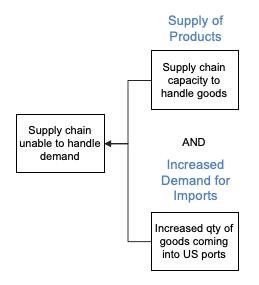
It has been reported1 that in September 2021, imports were up 5 percent year-over-year, and up 17 percent compared to September 2019. This is an indicator that a major contributor to shortages of consumer goods is an increase in the demand for those goods. The ports are moving many goods through them as they have in the past, but there is a limit on the overall capacity that our current demand is exceeding.
What is Driving Increased Consumer Demand?
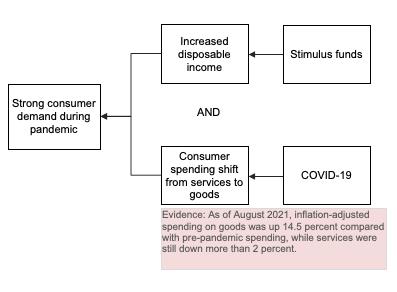
Consumer demand for goods has increased significantly during the pandemic as many people were unable to spend money in their budgets typically allocated to things such as services, eating out and vacations. While stuck at home, many consumers turned to buying goods with the extra room in their budget. Stimulus checks also contributed to consumer demand by increasing disposable income for certain groups who weren’t necessarily financially impacted by the pandemic. As of August 2021, inflation-adjusted spending on goods was up 14.5 percent compared with pre-pandemic spending, while spending on services was still down more than 2 percent.
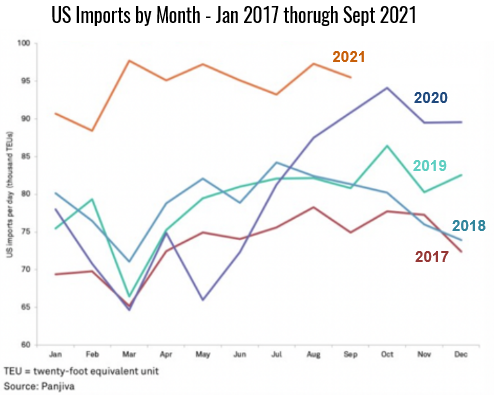
The chart below compares US imports by month from January 2017 through September 2021. Notice that by mid-summer of 2020, US imports skyrocketed to record levels and have remained high ever since.
Solutions: Focus on Causes You Can Control
One of the benefits of capturing the system of causes required for the effect to occur is that while there are likely causes you can’t control, there are also causes that you can impact. For example, as a consumer, you can’t control product inventory levels as the holidays approach, but you can time your purchases to get ahead of the increased seasonal demand.
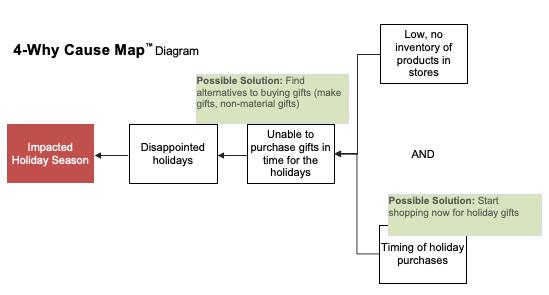
Another possible solution is to find creative alternatives to buying gifts for friends and family. For example, non-material gifts such as services, experiences or restaurant gift cards could be options. Custom-made gifts and buying local goods can be options as well. Be sure to check out the detailed Cause Map™ diagram below for the full details.
1September shows slower import growth; holiday trends emerge