On April 15, 2019, the world watched in horror as fire engulfed Paris’s 850-year-old Notre Dame Cathedral. The fire started around 6:20 pm local time, and it took hundreds of firefighters more than nine hours to extinguish.
Most of the cathedral’s centuries-old wooden roof was destroyed, including its famous spire, and the upper walls were severely damaged. Additionally, Notre Dame housed many religious relics and works of art. An estimated 5 to 10 percent of the artwork was destroyed, but rescuers were able to save many of the artifacts, including the Crown of Thorns, which is generally considered to be the cathedral’s most valuable relic. Thankfully, the building is still structurally sound, and the stone vaulted ceiling limited the damage done to the interior, but rebuilding the cathedral is going to be an extremely expensive and long process.
The investigation
The investigation into what caused this fire is ongoing. It has been reported that about 50 investigators are working on the case. Media reports have stated that investigators are looking into a possible electrical short circuit in an elevator.
There were also major renovations being done near the location where the fire was first reported, and investigators are working to determine whether there is a connection. It will take time to complete the investigation and the extent of the damage makes finding conclusive evidence challenging, but significant resources are being directed at the problem and more information will certainly be released in the future.
Organizing information
As with any investigation of this scope, there is a copious amount of information to organize. What is initially reported is often found to be incorrect later. As more information is uncovered, it can be difficult to keep track of it all and ensure that everyone involved is using the most current data.
At ThinkReliability, we use an Excel Cause Mapping template to organize our investigations. Obviously, not all investigations are as large as the investigation into the Notre Dame fire will be, but there is generally a large amount of data collected for any investigation.
It can be challenging to keep track of all of the information, and we believe the easiest way is to store everything in one file, rather than saving things in multiple locations. Our Excel template includes pre-loaded worksheets for photos, diagrams, a timeline, notes and other information along with worksheets for the Problem Outline and the Cause Map.
What we know
Once the initial incident report is available, a Cause Map can be built to document what is currently known. The initial Cause Map can later be expanded as more information is discovered and becomes available. If you are not familiar with our methodology, a Cause Map is a visual format for performing a root cause analysis investigation that intuitively lays out the cause-and-effect relationships that contributed to an issue.
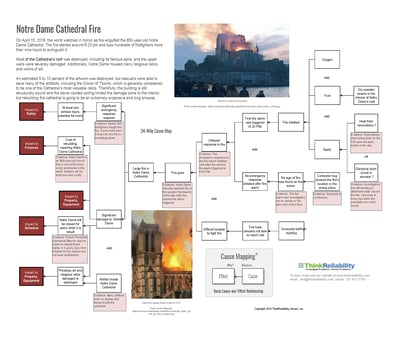
To build a Cause Map, you start at an impacted goal and ask “why” questions. Each answer is then added as cause box. For example, the significant damage to the Notre Dame Cathedral would be an impact to the property goal. Why was Notre Dame damaged? There was a large fire. More causes are added by continuing to ask “why” questions.
Possible causes can be included on the Cause Map by adding a “?” to indicate that more evidence is needed to determine whether or not it contributed to the incident. For this example, investigators are still working to determine what caused the Notre Dame fire, so the possible causes are included on the Cause Map with a question mark. Our preliminary Cause Map for the Notre Dame Cathedral fire is below. Click on the thumbnail to view a larger PDF.
A Cause Map can be a useful tool to help guide and document an investigation. Identifying where information is still missing on the Cause Map helps ensure the investigation addresses all the facets of the incident.
Storing all the information associated with an investigation in a single file can assist the investigation process and helps ensure that no information is misplaced or overlooked. Referring to the visual Cause Map during meetings and discussions can also improve communication with team members and easily allows people to stay on the same page while looking at the most up-to-date information.
There are additional cause-and-effect relationships that can be added to make this a more detailed Map. Both Maps are accurate, one just goes more in-depth. Are there any causes that you see missing? Leave us a comment below about what you would add to the Map.
Check out our previously published blog post titled, “How much detail is required in your root cause analysis?” to see just how much you need to include when investigating an incident.
The plan to rebuild
After a tragedy of the scale of the Notre Dame fire, a thorough investigation to understand what happened and what can be done to reduce the risk of a similar tragedy in the future is necessary. It is important to take stock of what was damaged, but it is also a time to be grateful for what has endured.
Quick work by rescue workers saved many of the priceless artifacts. Thankfully, efforts by emergency responders put out the fire before the entire building was destroyed. It has been reported that people have also pledged to donate more than a billion dollars to rebuild the cathedral.
French President Emmanuel Macron said he hopes to rebuild Notre Dame in 5 years. While I suspect that timeline is optimistic, I find comfort in the fact that Notre Dame will be restored.
Think this is interesting, and ready to hone your Cause Mapping skills? Join us May 23 at 10 am CDT for our FREE webinar: Introduction to Cause Mapping – Effective Root Cause Analysis.