
The Cause Mapping method of root cause analysis can be put into practice with pen and paper or even Post-It Notes on a blank wall or dry erase board. These tools for building Cause Map™ diagrams work well for some investigations, but many times, it can become difficult to document a large investigation with dozens of causes on paper. In addition, it can be a challenge to share the information with people (especially at other locations), or to save or store the Cause Map diagram between meetings.
At ThinkReliability, we have found Microsoft Excel to be a convenient and effective tool for digitally documenting a root cause analysis investigation. The functionality in Excel offers a wide range of capabilities that allow the flexibility needed to document both simple and complex investigations. Additionally, it doesn’t usually require purchasing new software since Excel is likely already installed on your computer and the computers of others who need to access the file.
The Cause Mapping® Template in Excel
We have developed a Cause Mapping template in Excel that you can download for free. The template can be edited however you would like to best meet your needs, and you are welcome and encouraged to share it with coworkers. There are no macros in it, so you should be able to use it as long as you can open an Excel file on your computer.
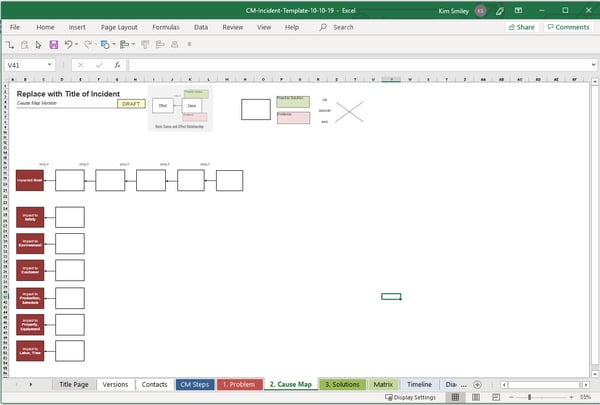
The Cause Mapping template can be used to document an entire investigation in a single file. For example, we have created worksheets to record the investigation team members, create a timeline, store pictures or diagrams, and there's a worksheet to build the Cause Map diagram itself. The gridlines have been removed from the Cause Mapping tab, so it looks like a large sheet of blank paper. There are some basic shapes, such as cause boxes, evidence boxes and arrows at the top that can be copied and used as the building blocks for creating a Cause Map diagram.
The Second Cursor in Microsoft Excel
While some people are more familiar with using programs like Visio to build diagrams, but Excel is a surprisingly powerful and flexible tool for documenting investigations. We use Excel to document the investigations we facilitate for our clients. Plus, all of the examples on our website and blog are built using our Cause Mapping template in Excel.
We use Excel’s drawing tools in a way that may not be familiar to some users, so you may need to learn a few new skills to quickly build a Cause Map diagram in Excel, but we have resources available to help you get started.
More Resources
Within the Cause Mapping Template
If you have downloaded the Cause Mapping template and don’t know where to start, then I recommend checking out the “Excel Tips” tab in the template. It explains the top three tips that will help you get started using the tool. You can also click on the “Watch the 3 key functions video” button in that tab and watch a six-minute video that demonstrates how to use the tips.
Webinar: Excel Tips & Tricks for Using the Cause Mapping Template in Excel
If you need a little more help than a six-minute video, this free 45-minute webinar is a great place to start. We offer a live, instructor-lead webinar about once a month. One of the benefits of attending a live webinar is you can interact with the instructor, but you can also view a recording of the webinar on-demand on our website at your convenience. This webinar walks through the different worksheets in he Excel template and demonstrates how they can be used during an incident investigation. It also covers how to build a Cause Map diagram in Excel using the drawing tools. (This webinar focuses more on using Excel and doesn’t go into detail on the methodology. Our Introduction to Cause Mapping webinar is a better starting point if you are unfamiliar with the Cause Mapping methodology and would like to learn more.)
Other Excel Webinars
You can also check out our other webinars that cover Excel topics once you are comfortable with the basics. For example, we have a webinar that focuses on using graphics and diagrams in Excel. Click on “Cause Mapping in Excel” on the column on the left-hand side of the "Webinar Archives" page to see the options.
Excel Tips Video Library
Do you have specific Excel questions? Check out our library of Excel tip videos. These videos are short (most are less than a minute) and to the point, and will walk you through a wide range of topics, such as adding a command to the quick access toolbar or selecting multiple text boxes. These videos are specifically helpful for Excel beginners who are feeling a little overwhelmed by jumping straight in to using the Cause Mapping Excel template.
ThinkReliability® Staff
And last, but not least, please reach out to us if you have questions on using the Cause Mapping template in Excel. We never want the tool to add confusion or frustration to your investigation, and we will do our best to help. You can email questions to info@thinkreliability.com or call our office at 281-412-7766.


