fmea-rca-connection.jpg

How are FMEA and RCA connected?

Mark Galley

Problem-solving and problem prevention

Problem-solving has two fronts: what DID happen in the past and what COULD happen in the future. Typically, a root cause analysis (RCA), which is also called failure analysis or accident investigation, looks back on what already happened. A failure modes effect analysis (FMEA) looks ahead to what could happen. Investigating why a problem occurred is reactive. Anticipating how something could go wrong is proactive. The information gained from reactive problem solving (RCA) helps to prevent problems from occurring in the first place (FMEA).

Think cause-and-effect basics

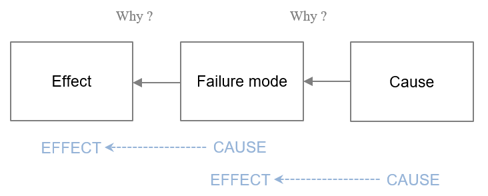
Cause Mapping® root cause analysis is based on cause-and-effect. By working backward, a Cause Map™ diagram reveals the cascade of events that produced a problem. Basic and complex problems are both explained with simple cause-and-effect relationships. A Cause Map diagram provides a visual layout of how all the causes fit together. It’s a platform for identifying different solution options. Cause-and-effect is the basis of both root cause analysis and FMEA.

Failure modes, effects and causes

A conventional FMEA is built into a table so that numbers can be attributed for severity, consequence and occurrence. The failure modes are sorted by risk using the risk priority number (RPN). The second column of the table is usually the failure mode. The effect is the third column and the cause is the fifth column. This order helps populate the table, but it can obscure the simple relationship between failure modes, effects and causes. They can seem distinctly different, rather than connected. A failure mode is a way something can fail. Fundamentally, a failure mode is a cause of the effect. And, it’s an effect of its cause. Using our Cause Mapping convention, the order looks like this:

fmea-rca-cause-and-effect

Printer jam example

The relationship between failure modes, effects and causes is easier to understand visually on a Cause Map diagram. As an example, consider different ways your printer at home or work could fail. One way may be the top guide which can cause the paper to jam. It can also be out of ink or toner. Cause-and-effect puts them in this order:fmea-rca-printer2

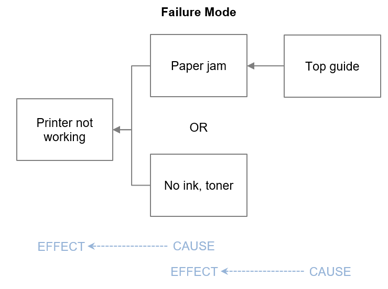
There are other ways the printer can lose function. It can be out of paper, lose power or there can be an issue with the network connection. And there are different failure modes (causes) for each of those. Capturing this type of detail is essential for organizations to have a complete understanding of their problems – to prevent them. Many industries take full advantage of this tool. Many do not.

The manufacturer of an aircraft is required to perform an FMEA for the entire aircraft – all systems. This scale of thoroughness, through all phases of the aircraft design, manufacturing, operation and maintenance begins to explain how airlines achieve such amazing reliability. Industrial manufacturers like chemical plants and refineries conduct Process Hazard Analyses (PHAs) which is another forward-looking cause-and-effect tool to anticipate how systems could fail.

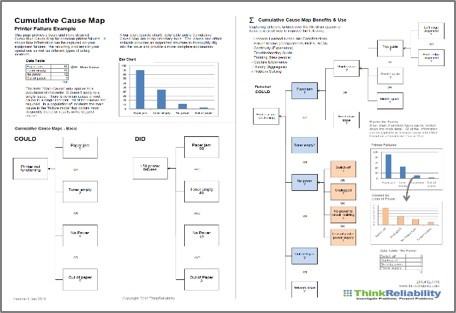
Visual FMEA - A Cumulative Cause Map™

An FMEA table may be 10 failure modes, 1,000 or 10,000. An FMEA table may fit on one page or fill a 150-page binder. Regardless of size, all the information from an FMEA can also be captured on one visual Cause Map diagram. We call it a cumulative Cause Map diagram because it’s a collection of all the different failure modes. A cumulative Cause Map doesn’t replace the FMEA, it complements it. A cumulative Cause Map diagram is ideal for recurring safety incidents, equipment failures or operational problems. Aggregate information is captured in one place. It can used as a troubleshooting guide and a training tool. Organizations that didn’t originally conduct an FMEA can begin collecting their failure modes (capturing those lessons) on a cumulative Cause Map diagram as they occur. Better late than never.

Download the cumulative Cause Map diagram PDF for the printer:

New Call-to-action


Using the Cause Mapping® Template with an FMEA table

The FMEA and the cumulative Cause Map diagram can both be kept within our Cause Mapping Template in Microsoft Excel. The complete FMEA table with rows and columns is built on one worksheet and the cumulative Cause Map diagram is on the next worksheet in the same file.


Share This Post With A Friend


Similar Posts

Facilitate Better Investigations | Attend a Webinar