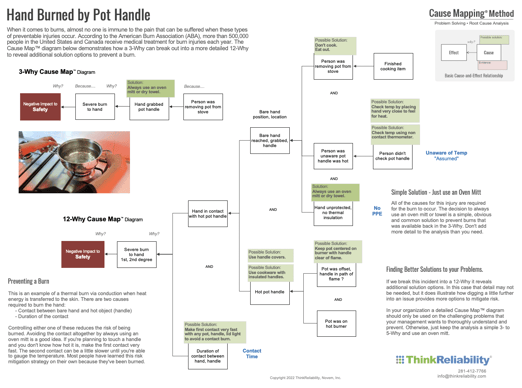
When it comes to burns, almost no one is immune to the pain that can be suffered when these types of preventable injuries occur. According to the American Burn Association (ABA), more than 500,000 people in the United States and Canada receive medical treatment for burn injuries each year.
The first full week in February is National Burn Awareness Week, so we’ve created a Cause Map™ diagram to help illustrate some causes and possible measures to mitigate risk, increase safety, and help prevent burn-related injuries.
The Risk for Burns Spans All Ages and Applies Both in Homes and Industries
Thermal burns can happen to anyone of any age. While most of these types of accidents happen in home kitchens, they’re also common in the workplace. According to the Bureau of Labor Statistics, 6,910 workers in the accommodation and food services industry lost time from work in 2017 due to burns caused by heat. But kitchens aren’t the only places where direct contact with a hot object result in an injury. Burns are a workplace safety concern for industries ranging from heavy manufacturing to emergency services, construction, automotive, and other industrial settings.
We’re using an example of a burn caused by grabbing a hot pot handle, but it’s important to note that with slight modifications, the Cause Map diagram we create can be applied to any burn situation — thermal, chemical, electrical, or friction — in which contact is a key element. Solutions from one burn incident investigation can help prevent other similar types of risk in the future.
Exploring the Causal Relationships in a Hot Pan Handle Burn Incident
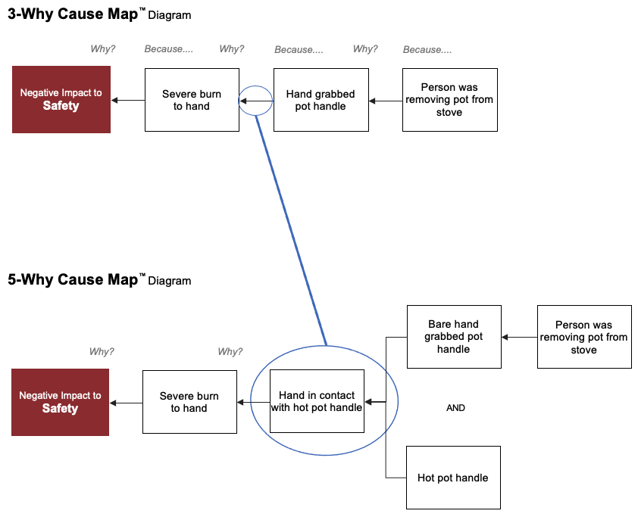
Below is a linear 3-Why of a burn-related incident. To read the diagram, think about how a 3-year-old bombards their parents with Why questions and how the answer to those questions typically starts with "Because." In the case below, the negative impact to the safety goal was a burned hand. Why did the person burn their hand? Because they grabbed the pot handle. Moving from left to right along the boxes, the next question would be, "Why did the person grab the pot handle?" And the parent would say, "Because they were removing the pot from the stove."
Why questions from a 3-year-old move backward from the effect they're curious about. Our Cause Mapping® method of root cause analysis does the same thing, but by writing it down we can build a diagram of the analysis. The Cause Map diagram shows how all the different parts of an incident fit together in cause-and-effect order.
The 3-Why Cause Map diagram above is accurate, but by breaking the incident down further, the specific contact between the hand and the hot pot handle can be added. Our Cause Mapping workshops teach people the cause-and-effect principles that allow them to dig into all problems they might be experiencing.
By asking one more Why question, the 3-Why above can split into a 5-Why with two paths (a parallel path). The 5-Why Cause Map diagram shows that for a person's hand to come in contact with a hot pot handle, the person had to place their bare hand on the handle AND the pot handle had to be hot. Notice that we've added the word "bare" to the expanded Cause Map diagram, and it wasn't on the initial 3-Why. A problem analysis in your company should start simple. You can add details as they become available and you continue to dig into an incident.
By tapping into their inner 3-year-old and continuing to ask Why questions, our users can turn a basic 3-Why into a 5-Why, 8-Why or 12-Why (and beyond!). Breaking a problem into parts provides a more thorough explanation, allowing access to an expanded solution set. Limiting a root cause analysis to a set number of boxes or causes restricts an organization's ability to access ideas for creative solutions. Many organizations don't realize their problem-solving model might be causing them to overlook solutions.
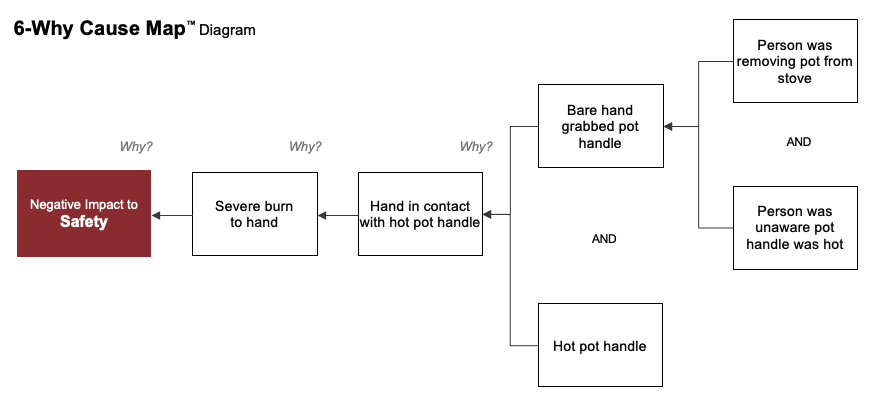
For this analysis, after our 3-year-old asked why someone would use their bare hand to grab the pot handle, below we've expanded further into a 6-Why where we've added an additional cause: Person was unaware that the pot handle was hot. The next question to be asked is, "Why were they unaware?" If you are having flashbacks to spending time with your favorite inquisitive child, you're doing it right.
This additional path in the analysis can reveal specifics about the organization's work processes (procedures) and its culture. In the solutions discussion of your Cause Mapping investigation (Step 3), it's important to ask the people who perform the task, "What can we do to build in a reminder or notification to ensure we don't overlook this hazard." While this example is a simple hot pot handle, the question about being "unaware" (and the potential solutions that come from identifying it) might apply to many different areas within your operations.
Building in Layers of Protection Using Causes as Control Points
A key to risk mitigation and accident prevention is building in what’s known as layers of protection. When any single cause is controlled, it reduces risk and helps prevent the incident from occurring. When multiple causes are controlled this results in a cumulative reduction in risk, or layers of protection.
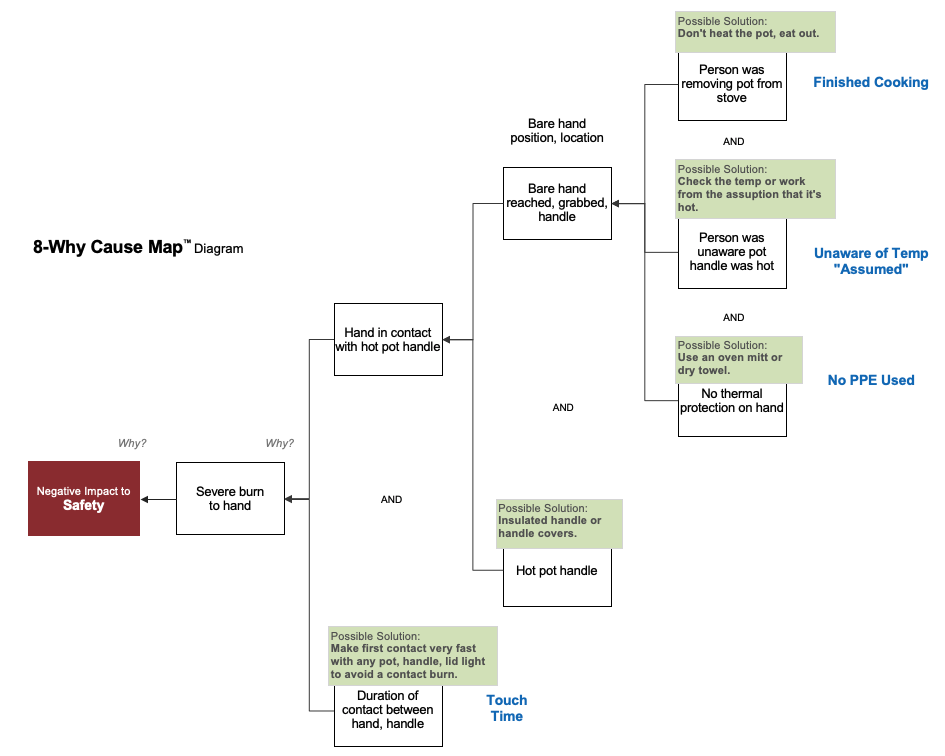
On the 8-Why Cause Map diagram below (click the image for a larger view), you can see that specific solutions control the specific causes you reveal through the analysis. The best solution to a complex problem is a combination of several strategies, which creates a cumulative reduction in risk, or layers of protection.
To help prevent burns sustained through grabbing a hot pot handle, you could consider the following causes as control points. In doing so, you create cumulative risk reduction and help prevent burns.
No thermal protection on hand. If the person in this example would've been using PPE, it would've been a different story. Oven mitts or dry towels can provide additional insulation, resulting in a safer temperature for picking up the pot.
Unaware pot was hot. If the person knew the pot handle was hot enough to burn them, they likely would not have grabbed the handle. Potential solutions could include using an infrared or kitchen thermometer or dropping a droplet of water on the handle to see if it evaporates. Additionally, the person could assume that all pot handles will be hot while cooking, and use an oven mitt.
Hot pot handle. Is there a way to ensure the handle doesn't get hot in the first place? Invest in pans with heat-resistant handles or add your own handle covers from a heat-resistant material such as silicone.
Removing pot from the stove. While it might seem like a silly solution, if the person had ordered take-out or eaten at a restaurant they would not be cooking to begin with, so the burn could've been prevented.
Expanded Causes Allow for Expanded Solutions
When conducting root cause analysis and creating a Cause Map diagram, remember that controlling one of the causes can help reduce risk and prevent negative outcomes. You don’t have to control every cause to prevent a problem, which is a common misconception. The more you expand your Map, the more potential solutions will emerge and you can select the best or combination of the best for your organization.
Thermal burns can be serious, but through increased awareness of hazards and by making simple environmental or behavioral changes, risks can be decreased, and burns can be prevented.
If you’re interested in seeing an expanded 12-Why Cause Map diagram, download it here, or check out some of our case studies to see how we use our Cause Mapping method to help solve both personal and business problems effectively.
Join Us for a Free Live Webinar
To coincide with Burn Awareness Week, we’re offering a free live webinar: “Fires & Industrial Explosions.” We’ll discuss how the fire triangle, fire tetrahedron and dust explosion pentagon can be presented as a Cause Map diagram to aid in finding solutions to reduce the risk of fires and chemical explosions.

