The template, which we provide for free, is a workbook in Microsoft Excel created specifically to allow users to document, analyze and present their root cause analysis within one file. This free template contains a worksheet for each element of a comprehensive problem analysis, including a problem definition, 5-Why Cause Map™ diagram, full Cause Map diagram, timeline, photos, diagrams and action items.
Template Explained
The 19-worksheet template is completely free to download and does not require any plug-ins. Each worksheet has a specific purpose within the investigation and allows you to document the different parts of a complete incident investigation. This one file allows you to capture a basic, mid and detailed level analysis, along with all the evidence, photos, diagrams and drawings. Different policies and procedures, PDFs and PowerPoint slides can be housed within one file.
The worksheets are:
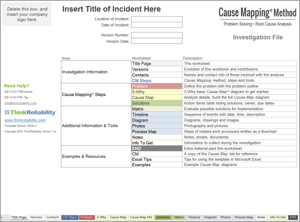
Title Page - Give a title to your incident and see the table of contents of the rest of the Microsoft Excel workbook.
Versions - Allows you to keep a record of how long you spend on the investigation and who has been involved in each stage of the analysis.
Contacts - List those people involved in the investigation, as well as their contact information, for easy reference.
The Cause Mapping method of root cause analysis includes three problem-solving steps: problem, analysis and solutions. The template is set up to mirror that investigation process.
CM Steps - A reminder of the three steps within the Cause Mapping method, which are define the problem, analyze it and then find solutions.
Problem (Step 1) - Rather than writing sentences in a problem description or problem statement, this is a one-page form where you can document a complete problem definition. The specifics about the problem, and when and where it happened are captured here. The consequences of the problem (the specific impact to each of the organization’s overall goals) and frequency of occurrence are also included in the problem definition.
5-Why (Step 2) - You can begin any investigation regardless of its complexity with a few Why questions. This worksheet gives you a place to start with a simple, single path cause-and-effect.
Cause Map (Step 2) - This is where your full or detailed cause-and-effect analysis can be expanded and built out. Each one of the goals is listed on this worksheet, so you can quickly begin. It also includes evidence boxes, solution boxes along with the ANDs and ORs, so you can easily copy and paste them to use in your Cause Map diagram.
Solutions (Step 3) - As solution options are developed, you can list them in this table along with the specific cause they control and the work process in which the change is being made.
Matrix - The solutions matrix is a qualitative tool used as part of evaluating solution options. It allows users to consider the effort that would go into each solution and the estimated benefit out. The solution matrix is a visual way to evaluate each solution as well as consider different combinations of short- and long-term solutions.
Although the problem-solving process consists of three fundamental steps, there are a number of information tools and resources that support and clarify the investigation. The worksheets in this section of the template provide a space for additional evidence documentation and even evaluating work processes.
Timeline - When people provide information about when something happened (the chronology), you can jump to the timeline tab to add the information. Timelines can be basic with just a few entries or include a significant amount of detail and background information, depending on how complex the incident is. (Learn more about the difference between chronology and cause and effect, and why you should work your problems backward here.)
Diagram Use this worksheet to paste in a drawing or chart. You can also build your own diagrams of a job site, room layout, tool, equipment machinery or other relevant graphic that better explains what or why something happened.
Photos - Here, you can insert and label photos collected as evidence during the investigation. All of your photos can be resized and organized to display clearly on one worksheet.
Process Map - The different causal paths uncovered during the analysis will reveal breakdowns within specific work processes. Use this worksheet to lay out the steps of your company’s work process, where it broke down and what changes can be made.
Notes - If you have PDFs, Word documents or other notes you need to make as your facilitation continues, you can add those notes here.
Info to Get - This worksheet gives you a place to list the information you need to gather as part of the investigation process. Those question marks that require further investigation in the analysis can be assigned an owner and deadline.
End - This marks the end of the investigation worksheets. The items after this worksheet are provided for your reference.
CM - This is a copy of the "Cause Map" tab earlier in the workbook. If you accidentally delete one of the goals or need a fresh worksheet for some reason, you've got another one to duplicate and build on.
Excel Tips - This is a reference guide for some of the most useful tips and shortcuts in Microsoft Excel for using the template. If you're looking for additional tips for using Excel for the Cause Mapping method, check out our video library.
Examples - This worksheet includes examples of linear and parallel cause-and-effect relationships, as well as an example of a cumulative Cause Map diagram (a visual FMEA).
What's New
We are constantly working to improve the services and materials we offer our clients. This updated version of the template has an updated look and includes some of the following changes:
- Added a 5-Why worksheet as a quick way to start a single path cause-and-effect analysis.
- Included a second "Cause Map" worksheet in the back, labeled "CM," in case you delete a goal box or need a fresh start on a new tab
- Set it up so worksheets can more easily be printed on a standard 8.5" x 11" piece of paper.
Watch the video below to see instructor and facilitator Renata Martinez walk through the Cause Mapping Investigation template and its parts.
Getting Started
Looking for more in-depth instruction on using Microsoft Excel for your incident investigations? Register for one of our upcoming online short courses focused on mastering your skills in Microsoft Excel. See the full schedule of upcoming short courses here.
Download the Latest Version
Download your free copy of the updated Cause Mapping template by clicking on the image below.