
Don’t touch your face. Wash your hands with soap for at least 20 seconds. Cough or sneeze into your elbow. The CDC and other entities have asked people to take preventative measures like these in order to mitigate the risk of contracting COVID-19. This is the second blog in a series demonstrating how a Cause Map™ diagram helps explain the specific actions that we can all take to avoid contracting the deadly virus.
Last week, I posted a blog about how increasing humidity not only reduces risk of transmission but also works to support your immune response. This week, I’d like to demonstrate how this same visual analysis tool, the Cause Map diagram, helps explain the specific actions that we can all take to avoid surface contact and transmission of an infectable virus. Because, ultimately, the better we understand the complex cause-and-effect relationships within the transmission of COVID-19, the more effective solution options we have to lower our chance of contracting it.
Contact is a Fundamental Relationship
First and foremost, in order for infection to occur, the virus must make contact with human cells inside your body. The most likely avenue of transmission into your body is through your eyes, nose and mouth. When analyzing transmission from hand to face, the fundamental relationship for contact is required. You must have an infectable virus (hazard) on your hand and your hand must come into contact with your face (target).
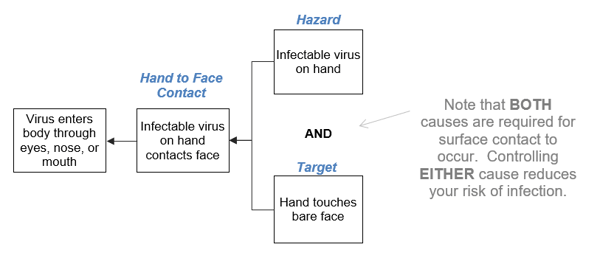
As the Cause Map diagram demonstrates with the AND relationship, controlling EITHER cause will reduce your risk of infection. Controlling BOTH will significantly reduce your risk of infection. Interestingly, you might be surprised how much you touch your face throughout the day. Studies have shown the average person touches their face 23 times an hour. Is it possible to break that habit? Sure. It’s hard, but the first step is recognizing the problem. (Are you touching your face right now? Stop!) Here we find another opportunity to mitigate risk of the virus entering your system. For example, proper use of a face mask can help prevent your hand from making direct contact with your face.
Lower the Risk of the Live Virus on Your Hands
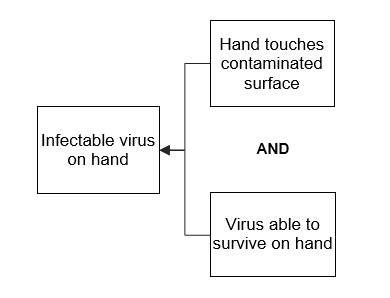
The other cause required for contact is for an infectable virus on your hand. Do you recognize the two causes required? As the Cause Map diagram shows below, your hand must make contact with the virus on a contaminated surface AND the virus must be able to survive on your hand long enough to make contact with your face.
If we analyze virus survivability, this is where we see actions like hand washing as an effective way to control the cause. But do you know why? Do you know how soap helps prevent infection? By breaking down the specific causes into greater detail, you can better understand and, accordingly, adjust your actions.
If we break it down further, we get deeper into the science of this cause-and-effect relationship. Just like influenza, COVID-19 has a protective lipid envelope, which primarily consists of fats. When using soap to wash your hands, you are doing two things to rid your hands of the virus:
- Lathering up soap and water helps remove the virus from the surface of your hand.
- Soap molecules work to break down fats, including the lipid layer of the virus, leaving it unprotected and rendering it essentially ineffective.
So even if the virus isn’t removed from your hands, its ability to cause infection is neutralized. We see how that breaks out here:
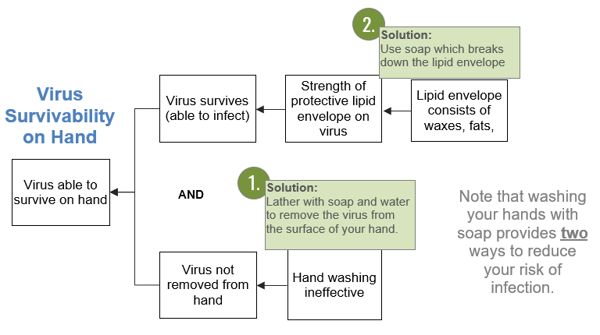
Given this detailed explanation on the Cause Map diagram, you can see that washing your hands with soap provides two mechanisms to mitigate risk. Due to the lipid structure of the virus, any old hand soap will do—antibacterial soap isn’t necessary to prevent the spread of COVID-19.
Surface Type Makes a Difference
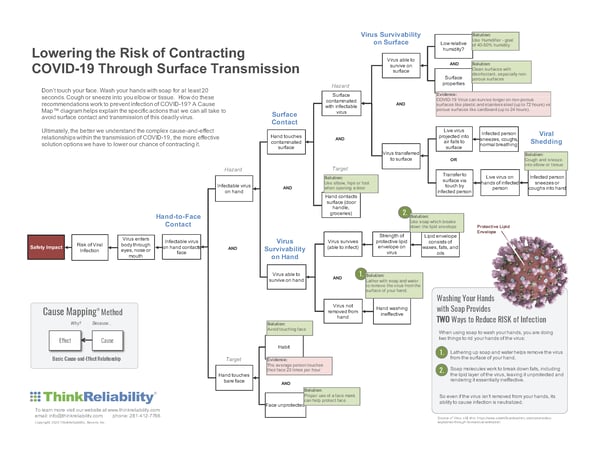
Interestingly, the ability of the virus to infect varies based on the surface it’s on too. In a letter from the New England Journal of Medicine published on March 17, 2020, researchers shared recent findings that the COVID-19 virus remains live (able to infect) for a longer period of time on most non-porous surfaces such as plastic and stainless steel, when compared to copper and cardboard. The virus was still viable on plastic and stainless steel surfaces up to 72 hours later. On cardboard, however, the virus wasn’t viable after 24 hours. One outlier was copper, which has long been known for its antiviral properties. On the copper surface, the virus wasn’t viable after 4 hours. It should be noted, however, the CDC reported the coronavirus survived on one of the quarantined cruise ships for 17 days, though further analysis should be conducted given that the rooms had been preserved. Because COVID-19 is a new threat, all research is still early and requires further exploration, but it is an interesting point to note that the surface type could offer another solution opportunity to mitigate risk of infection. This should be taken into consideration as you bring outside items like groceries into your home. You can download full surface transmission Cause Map diagram PDF by clicking the image below.
One final note, in my previous blog, I highlighted the role of increasing humidity in reducing survivability of the influenza virus. It should be noted that other causes (like humidity) may also play a role in the survivability of the COVID-19 virus.
Obviously, this is an incredibly complex issue with many questions still unanswered. However, the ability to thoroughly explain the causes required for surface transmission will provide a better understanding of how we can mitigate our risk. Be sure to download a copy of the detailed PDF, which provides a complete Cause Map diagram for infection via surface contact.
This is the second blog in a three blog series on reducing your risk of contracting the COVID-19 virus. See how the full Map of this complex issue during my upcoming webinar, "Reduce Your Risk of COVID-19 Infection: How a Cause Map™ Diagram Makes Sense of a Complex Issue" on April 8, 2020.

Remember, I am not a healthcare professional and this should not be taken as medical advice. For those healthcare professionals, scientists, frontline workers and all the people working to keep us safe and healthy during the pandemic, again, we sincerely thank you.


