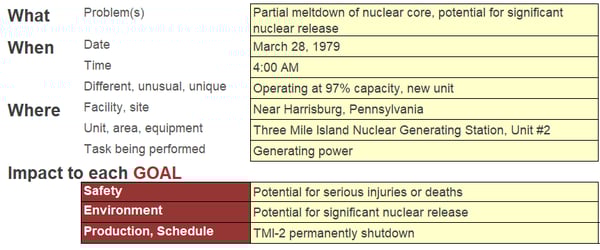
On March 28, 1979, there was a partial meltdown of the core in the number 2 reactor at Three Mile Island Nuclear Generating Station (TMI-2) near Harrisburg, Pennsylvania. This incident remains the worst accident in the history of U.S. commercial nuclear power. No one was injured and there was no significant release of nuclear radiation, but there was the real potential for a major disaster. The accident also stoked concerns about the safety of nuclear power and led to a drop in public support for nuclear power.
Getting to the root of the problem
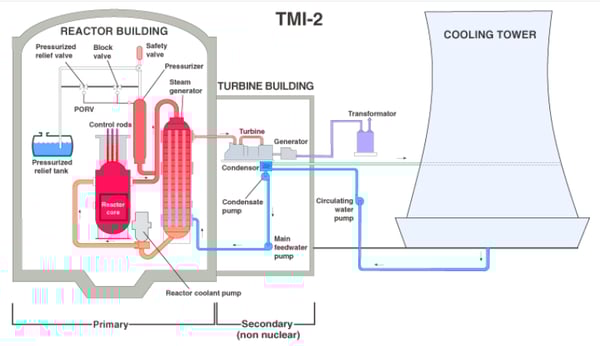
Like nearly all accidents, a number of factors contributed to the accident at TMI-2. In order to understand what occurred at TM1-2, it is useful to know the basic plant design. TMI-2 had a closed primary loop where primary coolant was heated as it flowed through the reactor core and cooled as it transferred heat through the steam generator to the secondary loop. The heat that was transferred to the secondary loop was then used to turn a turbine connected to a generator to produce electricity.
With something as complicated as the accident at TMI-2, it can help to have a simple method to organize the information. A Cause Map, an intuitive method for performing a root cause analysis, can be built to visually layout the cause-and-effect relationships of the causes that contributed to the accident. The first step in Cause Mapping it to define the problem by filling in an Outline which includes listing the impacts to the organizational goals. The Cause Map is built by starting at one of the impacted goals and asking “why” questions. Each answer to a “why” question is added as a box to the Cause Map. An example of a filled in Outline for TMI-2 is below.
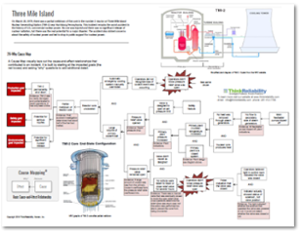
So WHY was there a potential for a significant nuclear release? There was a partial meltdown of the reactor core because the core was uncovered, meaning it didn’t have coolant on it to help transfer energy away from the core and it melted when the temperature increased significantly. The reactor was uncovered because a large volume of primary coolant was lost through a pressure relief valve. The Cause Map can continue to be expanded by asking “why” questions. To view a high-level Cause Map of this incident, click on the image below and download the PDF.
Stuck open relief valve
The accident began with failures in the secondary loop that resulted in a loss of feedwater to the secondary side of the steam generators, meaning that heat and pressure increased in the closed primary loop. The plant was designed to withstand a loss of feedwater, but an additional failure of a primary pressure relief valve magnified the problem.
The pressure relief valve (the safety valve labeled in the simplified system diagram above) was designed to open when the primary plant pressure increased above a set limit. The relief valve lifted as a result of the increased pressure after the loss of feedwater as intended, but it failed to reseat as designed after pressure decreased. The valve remained open as coolant continued to flow out of it until a manual block valve was closed to isolate it.
Operators unaware valve was open
As mentioned above, there was a block valve that could have been shut to stop the loss of coolant, but operators were unaware of the fact that the valve was stuck open. They did not take action to mitigate the situation until it was too late to prevent the partial meltdown of the core.
It is easy to see what was occurring in TMI-2 with the benefit of hindsight, but it wasn’t clear as the incident played out. The control room at the plant was huge and had hundreds of indications. When this incident occurred, operators received dozens of alarms, both audible and flashing lights, in a short period of time without any obvious priority.
In addition, operators had false indication that the pressure relief valve was closed. There was a light that operators assumed indicated valve position and it showed that the pressure relief valve was closed. The indication actually showed the status of the solenoid that operated the pressure relief valve and only indicated whether the solenoid was powered or not, not whether the valve was actually closed. The solenoid had operated as it was expected to close the valve, but the valve had failed to reseat so the light indicated that the pressure relief was closed when it was not. Operators had not been trained on the fact that the valve indicator only showed solenoid status nor where they could look for alternative confirmation that the valve was closed.
Alarms continued throughout the incident and the sheer volume of information made it difficult to interpret the situation accurately. Add in the indication that falsely led operators to believe the valve was closed and an extremely high stressful environment and it is much easier to understand why it took them so long to isolate the leaking pressure relief valve than it may have at first glance.
So what is “the” root cause?
Many people are tempted to say the stuck open relief valve was “THE” root cause of the Three Mile Island accident and it was certainly a major factor, but it doesn’t tell the whole story. Identifying a single “root cause” is generally not helpful and tends to limit the solutions that are considered. Building a Cause Map and identifying the system of causes (plural) that contributed to an incident helps investigators dig deeper and naturally widens the solutions that are considered. For example, it is not only important to understand that the relief valve was stuck open, but to also understand why it took so long for operators to identify that it was open. We likely wouldn’t be talking about this incident today if operators had a better understanding of the plant conditions as the accident occurred and were able to quickly take actions to mitigate the incident. In my opinion, the biggest lesson to be learned from Three Mile Island is that operators can only make decisions that are as good as the information and training they are given.
Additional root cause analysis resources: