On the morning of March 26, 2024, I was preparing to deliver the first day of our monthly 3-day Cause Mapping® Root Cause Analysis Public Workshop. As participants filed into the conference room, their attention shifted to breaking news: the container ship Dali struck the Francis Scott Key Bridge in Baltimore, causing a catastrophic collapse.
At this point, our understanding of the Baltimore Bridge collapse was very limited. That’s a common challenge at the outset of investigations, and one that I knew our workshop participants would encounter when they returned to their companies. So, I decided to use the incident as a case study throughout the workshop. Here’s what our attendees and I documented over those three days.
Defining the Problem and Building a 5-Why Cause Map™
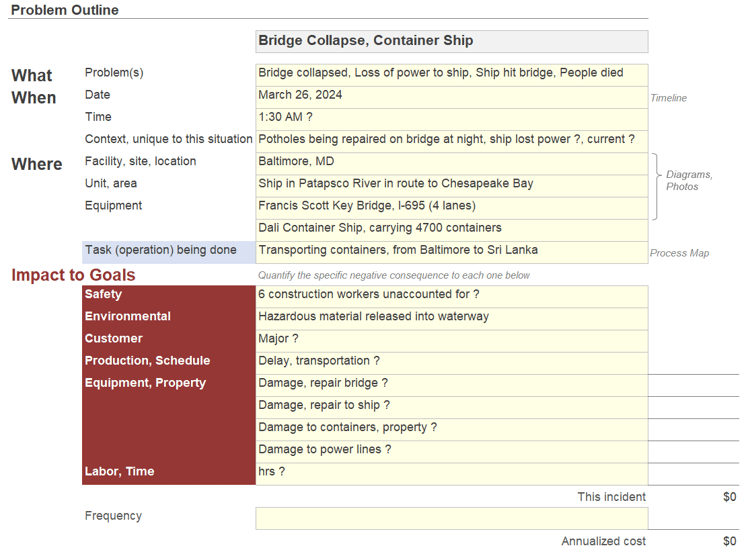
Cause Mapping root cause analysis starts with defining the problem. On the first day of the workshop, the participants and I used ThinkReliability’s Cause Mapping template to document what happened, when it happened, where it happened, and the impact to goals.
Baltimore Bridge Collapse Problem Outline
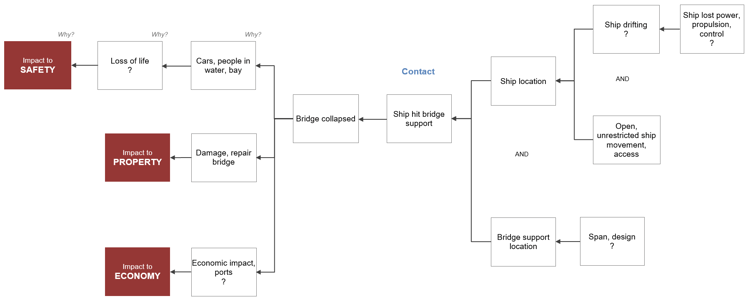
On March 26, we knew that a team of construction workers on the Francis Scott Key Bridge at the time of the incident were unaccounted for. Loss of life was likely, but not yet confirmed. Working from the safety goal, we built the 5-Why Cause Map diagram below, using question marks to indicate the need to gather more evidence.
Baltimore Bridge Collapse 5-Why Cause Map™ Diagram
Impact to Multiple Goals Expands Analysis to a 7-Why Cause Map™
We recognized that the incident also had an enormous impact on property, so we expanded our 5-Why Cause Map diagram into the 7-Why Cause Map diagram below. This Cause Map diagram shows how the bridge collapse caused a loss of life (thereby impacting the safety goal) and damage to the bridge (thereby impacting the property goal).
Baltimore Bridge Collapse 7-Why Cause Map™ Diagram with Impact to Safety and Property Goals
Building a 14-Why Cause Map™ to Illustrate a Fundamental Relationship
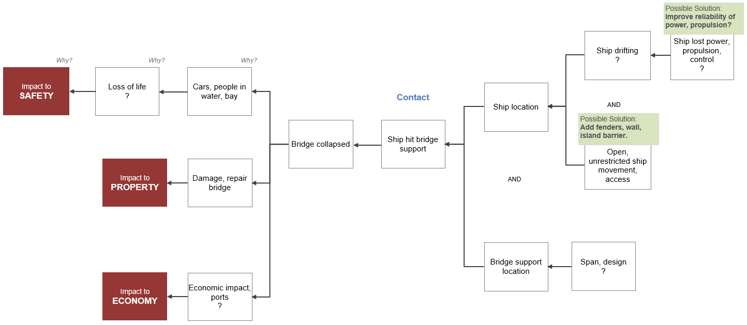
Over the next two days, workshop attendees and I added incoming details to our Cause Map diagram. The Baltimore Bridge Collapse is an example of a fundamental cause-and-effect relationship called contact, indicated in blue text in the 14-Why Cause Map diagram below.
Baltimore Bridge Collapse 14-Why Cause Map™ Diagram
Whenever we hear words such as “collision,” “hit,” or “struck by” in an incident, we recognize this as a contact relationship. Contact always requires two causes in parallel with an and relationship between them. For the ship to hit the bridge, the ship had to be located at its exact position and the bridge’s support had to be located at that same exact position—otherwise, they cannot be in contact.
Understanding this fundamental relationship helped all our workshop participants brainstorm solutions to control the cause “ship hit bridge support”—even though only one had any maritime experience. Whether at home or at work, all of us have experienced incidents that involve contact, such as a hand injury (contact between a hand and a hazard) or a car accident (contact between a car and a hazard). Whenever there’s contact, you can control either of the parallel causes to change the effect. The extent to which the effect is altered depends on the solution or solutions selected.
With the Baltimore Bridge Collapse, the attendees considered controlling the location of the bridge support—but that requires rebuilding the bridge. That’s necessary now, but it’s not very cost-effective as a preventative measure on an existing bridge. A more realistic option is to control the location of the ship by adding a protective fender or barrier to prevent the ship from reaching the bridge support.
Baltimore Bridge Collapse 14-Why Cause Map™ Diagram with Possible Solutions
The Long Road Ahead
The workshop ended on the afternoon of March 28, 2024, concluding our initial exploration of the Baltimore Bridge Collapse. Our thoughts remain with those affected by this disaster, especially the families of the six construction workers who perished. This incident serves as a stark reminder of the critical importance of thorough investigations and proactive safety initiatives in safeguarding lives and infrastructure.
Editor’s Note: This blog is the first part of a two-part series. View Part 2.


