
Each year, there are some 700,000 police-reported motor vehicle crashes that occur at stop signs, according to a PubMed report1. That’s nearly 2,000 reported incidents per day – a staggering number, especially considering the numbers are likely higher because some non-injury crashes may not be reported.
Clearly, that’s a problem.
To illustrate how digging into the specifics of an issue expands the options for reducing risk, we’ve created several Cause Map™ diagrams.
Cause and Effect Accident-Avoidance Question
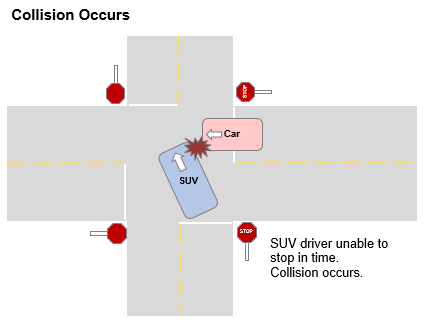
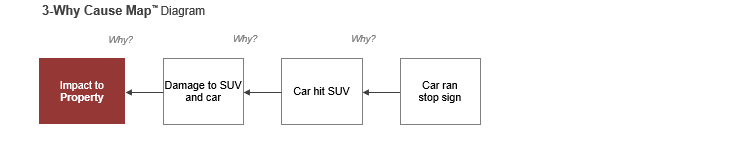
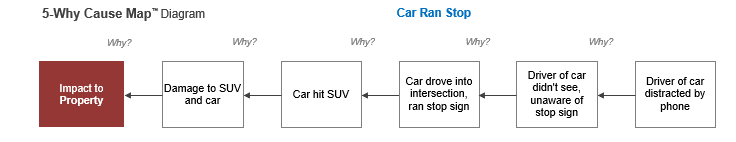
Consider the scenario where a red car ran a stop sign hitting a blue SUV. See the diagram below created using our Cause Mapping® template in Microsoft Excel. A simple 3-Why shows that the collision at the intersection was caused by a car running a stop sign.
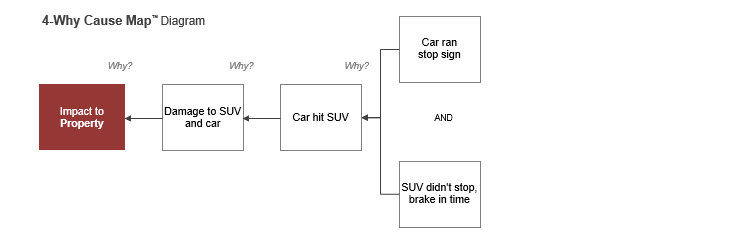
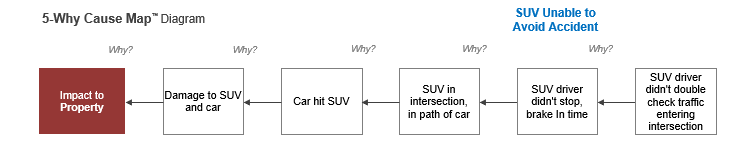
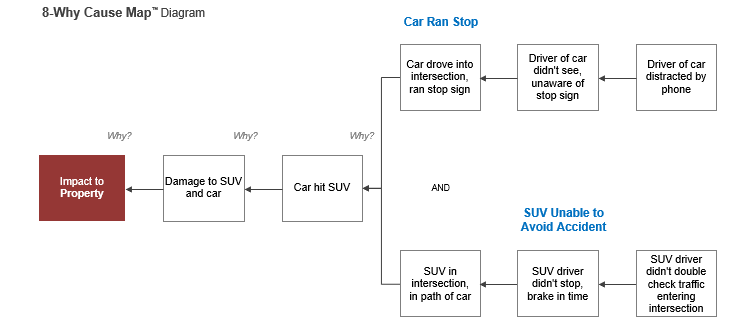
The car running the stop sign isn’t the only thing that had to happen for the incident to occur. The SUV was also unable to stop in time. The 4-Why below shows the two different causal paths with an AND between.
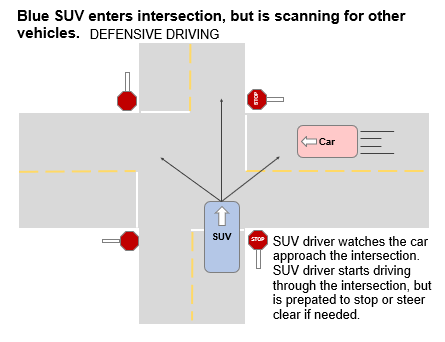
Could this accident have been avoided? If the driver of the SUV pulled into the intersection without ensuring that the red car was slowing down, avoiding the accident is far less likely. However, if the SUV driver doesn’t assume the red car is going to stop and verifies that the car is slowing down the risk of an accident is much lower.
Defensive driving measures like these – anticipating higher risk situations – are taught to new drivers to help prevent accidents. “Vehicle crashes are almost always a preventable result of a series of events,” SafeMotorist2 said on its online training site.
Expanding the Map to Reveal More Causes
When investigating an issue, whether it’s a traffic accident or something that’s severely impacting your company, it’s important to remember that problems have multiple causes. Focusing your investigation on finding one or two causes limits the analysis which restricts the solution set. Breaking a problem into its parts reveals different strategies for reducing the risk of similar incidents occurring in the future – also known as “layers of protection.”
This 5-Why shows that the car ran the stop sign because the driver of the car was unaware of the stop sign. Why? Because the driver was distracted by their phone.
There’s another causal path in which the SUV was hit because the driver was unable to apply the brakes in time to stop. This happened because the driver wasn’t checking to see if the car was slowing at the intersection.
Many people would say the driver of the SUV was not the cause of the accident. They see the error or violation as the red car running the stop sign. The driver of the SUV was just driving through the intersection. It was their turn to go, and they had the right of way. Yet they were still hit.
What caused the accident and how it can be prevented share an important connection in risk mitigation. It's not that the driver of the SUV was necessarily at fault, it's just that they had an opportunity to mitigate the risk of this incident.
Labeling something a “cause” just means it was required for the effect to happen. A cause doesn’t have to be negative or even a deviation to contribute to an incident. This is a regular point of confusion within an investigation because some believe causes are only the negative parts of an incident, but that’s not the reality.
Combining 5-Whys into a More Comprehensive 8-Why
As more causes are added to the cause-and-effect analysis more potential solutions can be identified. By combining the two 5-Whys above, it becomes clear that both the red car running the stop sign and the blue SUV in the intersection were required for the incident to occur. Changing either one of those causal paths changes the outcome.
Potential solutions include:
- Keep your eyes on the road while driving.
- If you’re using an app for directions, take quick glances or pull off the road.
The combined diagram adds solutions to help avoid a collision even if someone were to run a stop sign, such as:
- Be prepared to hit the brakes or steer away from other cars.
- Watch the other cars approaching a stop sign. Don’t assume the other vehicles will stop.
The objective isn’t to identify as many causes as possible. It’s to reveal as many causes as you need to find effective solutions that meet the organization’s overall goals.
Stay Grounded in the Basics
Cause Mapping root cause analysis provides people with a simple way to dissect complex problems by applying the basics of the cause-and-effect principle.
Download our free Cause Mapping template in Microsoft Excel to dive into your own operational issues that may be hindering your overall success and growth.
Our next Cause Mapping Root Cause Analysis public workshop is coming up soon. Register now to reserve your seat.

1 Retting RA, Weinstein HB, Solomon MG. Analysis of motor-vehicle crashes at stop signs in four US cities. J Safety Res. 2003;34(5):485-9. doi: 10.1016/j.jsr.2003.05.001. PMID: 14733981.


